JAMA & ARCHIVES
Arch Fam Med
SEARCH
GO TO ADVANCED SEARCH
HOME  PAST ISSUES  TOPIC COLLECTIONS  CME  PHYSICIAN JOBS  CONTACT US  HELP
Institution: CLOCKSS  | My Account | E-mail Alerts | Access Rights | Sign In
  Vol. 8 No. 2, March 1999 TABLE OF CONTENTS
  Archives
  •  Online Features
 Article Links
 •Return to Article

Downloading the PowerPoint slide may take up to 30 seconds. If the slide opens in your browser, select File -> Save As to save it.
Copyright restrictions may apply. Please see our Conditions of Use.


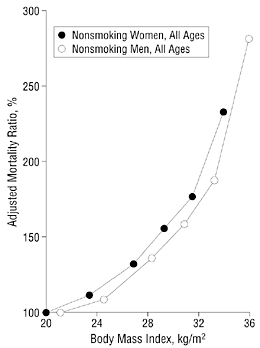
Figure 2. Adjusted mortality ratios in relation to body mass index of nonsmoking men and women of all ages. The lowest mortality ratio for each relative weight category is assigned a value of 100%. Adapted with permission from VanItallie and Lew.39


HOME | CURRENT ISSUE | PAST ISSUES | TOPIC COLLECTIONS | CME | PHYSICIAN JOBS | HELP
CONDITIONS OF USE | PRIVACY POLICY | CONTACT US | SITE MAP
 
© 2009 American Medical Association. All Rights Reserved.