|
If the slide opens in your browser, select File -> Save As to save it.)
Copyright restrictions may apply. Please see our Conditions of Use.
Click on image to view larger version.
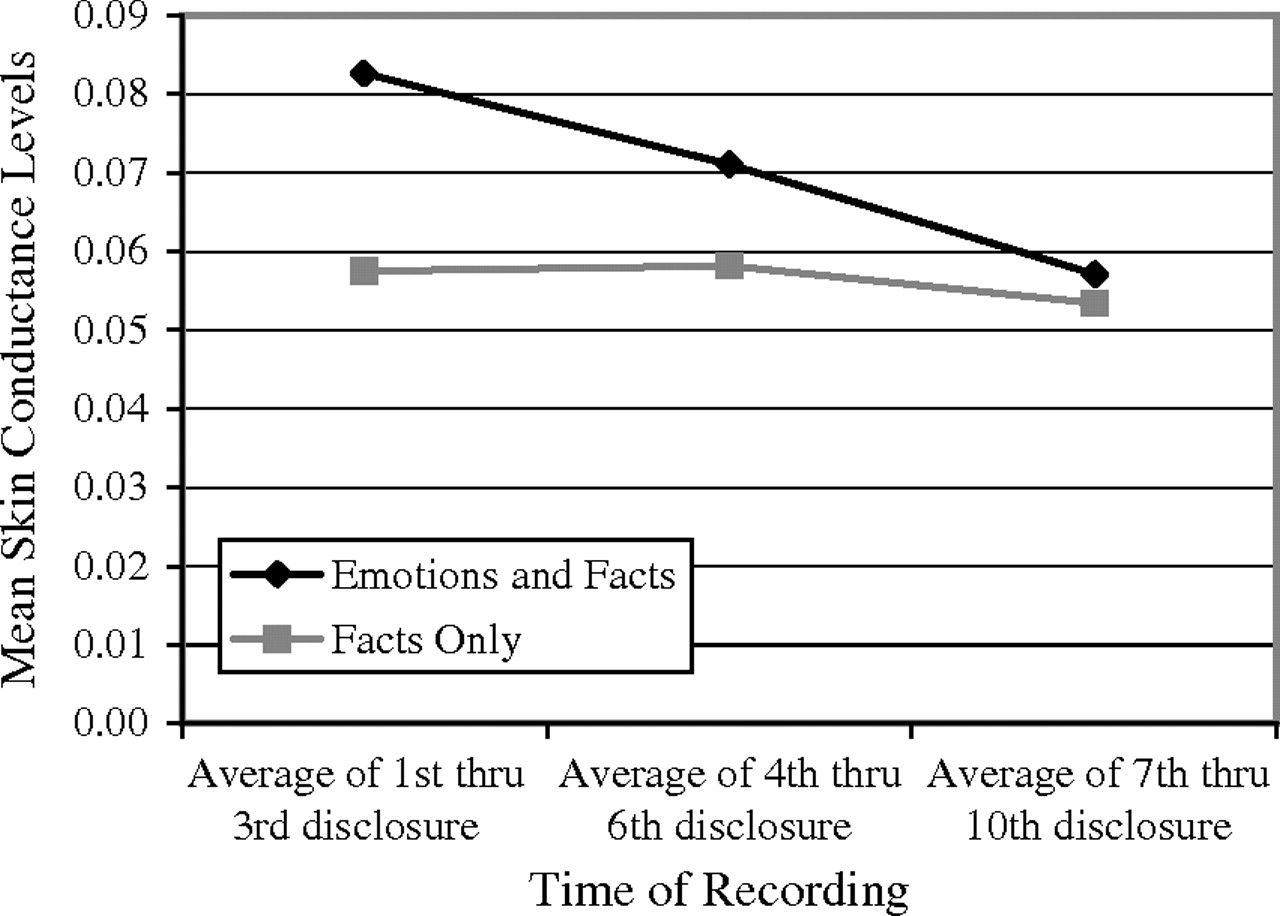
FIGURE 1 Mean skin conductance levels by group at various time periods.
|