Copyright restrictions may apply. Please see our Conditions of Use.
Click on image to view larger version.
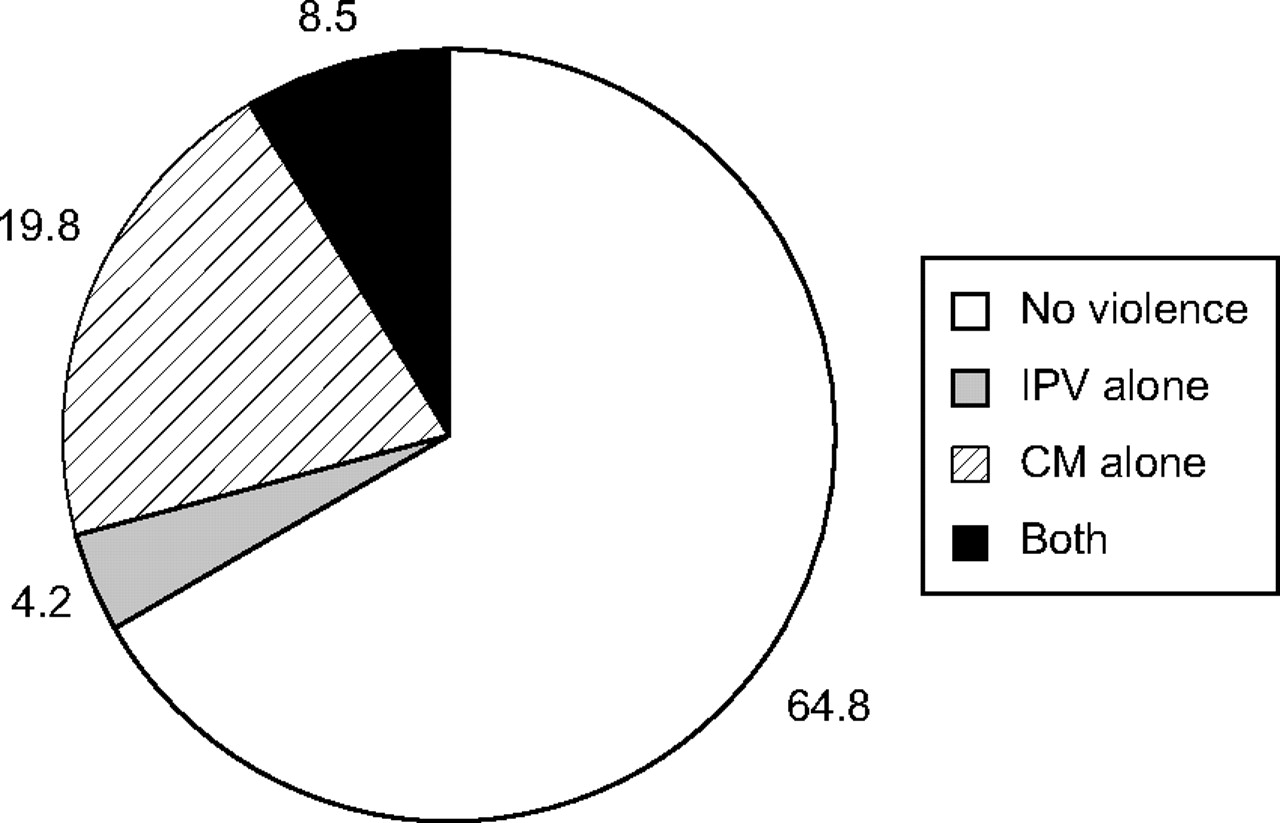
FIGURE 2 Percent of homes reporting IPV alone, CM alone, both, or neither (n = 1,232, weighted n = 554,194).