

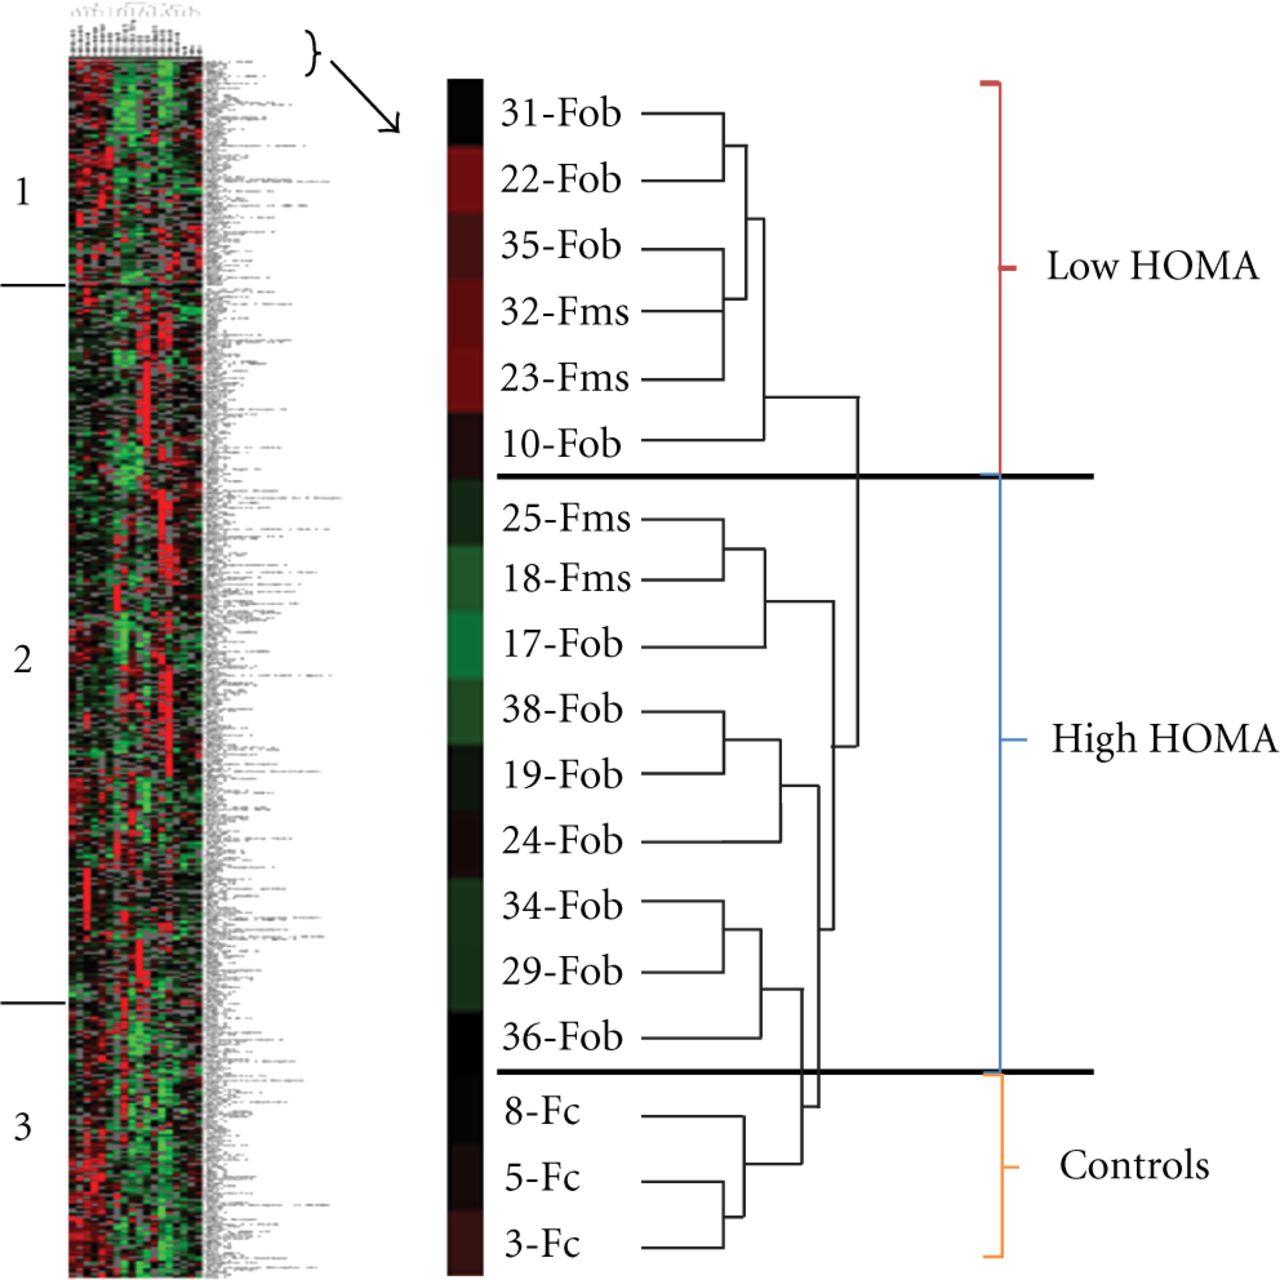
Cluster diagram representing plasma protein expression levels of female patient and control donors. Unsupervised clustering (Figure 1) separated the patients into two groups. Comparison of the patients in these groups to the clinical values revealed that the clustering correlates well with the HOMA values. Patients that clustered in what we designated the High HOMA group had HOMA values greater than 4.0 except for patients nos. 19 and 38 (7/9). All patients in the Low HOMA group had values less than 4.0. Based on a visual inspection on the cluster diagram, two regions of the protein set stood out as showing particular distinction between the groups. These proteins are in the two regions marked region 1 and region 2 on the diagram. Positive values represent binding increased relative to the protein standard and show up as red on the diagram, while values that are negative represent decreased protein binding and show up as green on the diagram.