- Institution: Stanford Univ Med Ctr Lane Med Lib/Periodical Dept/Rm L109
- Sign In as Member / Individual
Pharmacogenomics of Cystic Fibrosis
Genomic space as an indicator of the genomic state of cells in response to the drug candidate CPX.
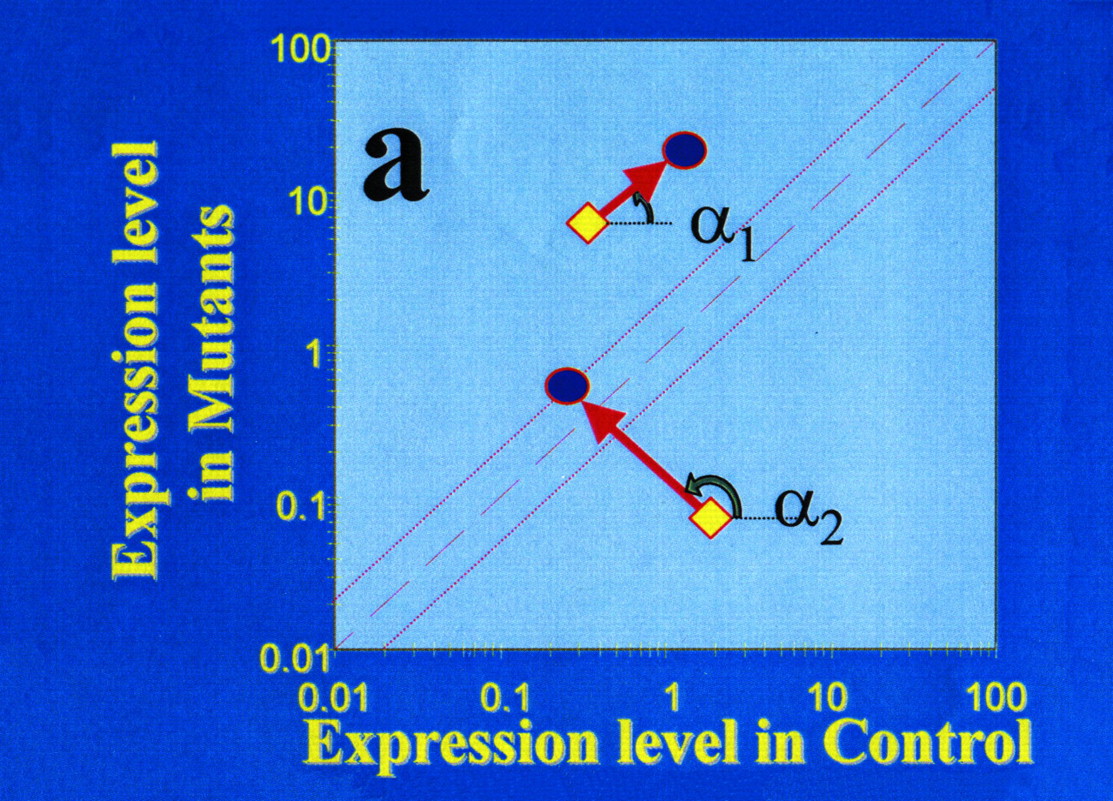
A. Genomic space is defined by a graph of global gene expression levels in HEK293 cells bearing either the wild-type (control; horizontal axis) or mutant CFTR gene (vertical axis). Levels of gene expression that are equivalent in the two cell populations will fall on the diagonal, whereas expression that is affected by the mutant CFTR are off the diagonal. Significant deviation from the diagonal can be defined in terms of standard deviations (see dotted lines on either side of the diagonal). The angle α denotes the direction of “movement in genomic space” in response to CPX; vector length denotes the magnitude of “movement”. The gene denoted by α1 is a mutation-dependent gene (i.e., deviates from the diagonal) whose expression is “moved” by the drug in a mutation-independent manner (i.e., “movement” is parallel to the diagonal). The gene denoted by α2 is a mutation-dependent gene whose expression is “moved” into the diagonal by the drug in a mutation-dependent manner; the drug thus brings the genomic state of the mutation-bearing cells (with respect to the gene denoted by α2) into closer agreement with the wild-type genomic state.
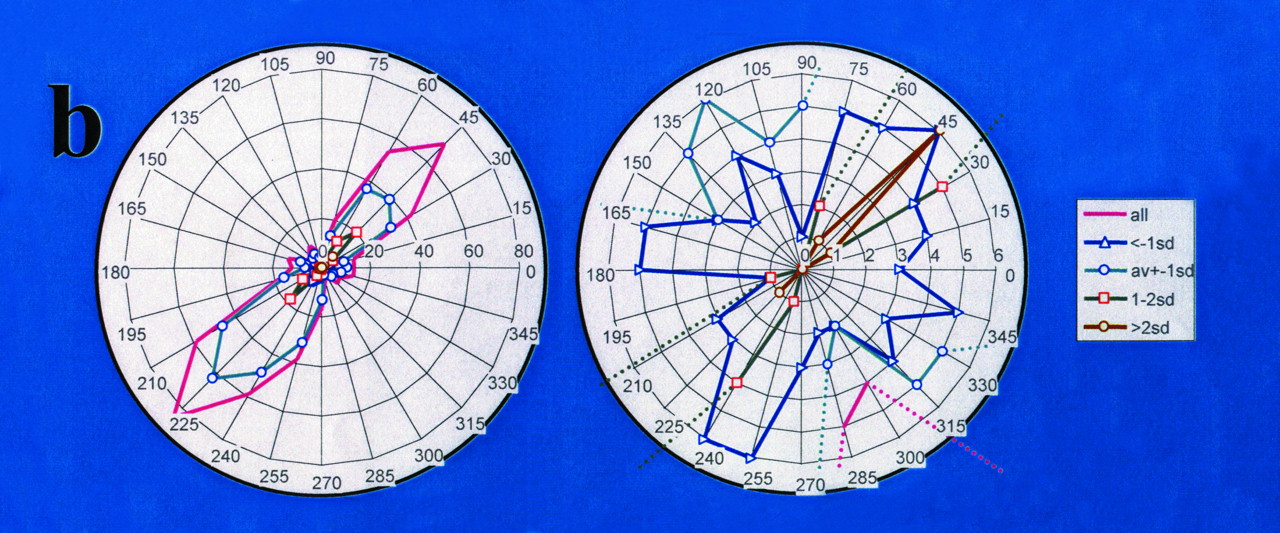
B. Radial plots of a complete data set from HEK293 cells, expressing mutant or wild-type CFTR, treated with CPX. The plot on the left is at low resolution; the plot on the right is at higher resolution. Drug-dependent movement up and down the diagonal is along the 45°/225° angle. Mutation-specific movement is approximately perpendicular to this diagonal. The radius is given in numbers of genes moving at a given angle. (Data are abstracted from (32); sd, standard deviation.)

