- Institution: Stanford Univ Med Ctr Lane Med Lib/Periodical Dept/Rm L109
- Sign In as Member / Individual
Localization of Receptor-Mediated Signal Transduction Pathways: The Inside Story
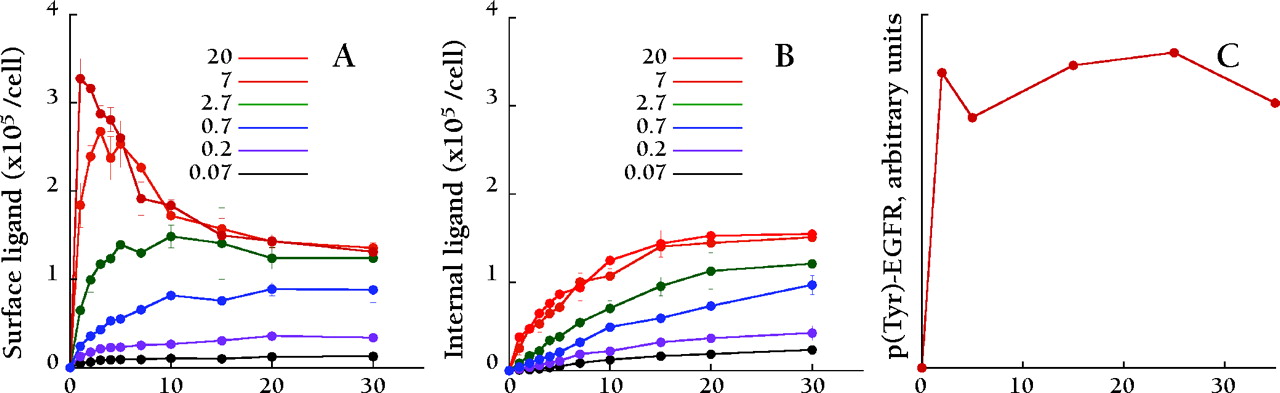
Figure 1.
Compartmentalization of active EGFRs. Time courses of surface-bound (A) and internal (B) EGF in NR6 fibroblasts expressing the human EGFR (J.M.H., unpublished). At time zero, cells were stimulated with a constant concentration of EGF (0.07, 0.2, 0.7, 2, 7, or 20 nM, from lowest to highest receptor binding), and surface-bound ligand was dissociated in pH 3 buffer at the indicated time points. C. Time course of EGFR autophosphorylation, 20 nM EGF stimulation, adapted from (27). Receptor activation changes very little in the first 30 minutes of maximal EGF stimulation, whereas after 24 hours these cells exhibit significant receptor downregulation (14).

