- Institution: Stanford Univ Med Ctr Lane Med Lib/Periodical Dept/Rm L109
- Sign In as Member / Individual
Galanin in Alzheimer Disease
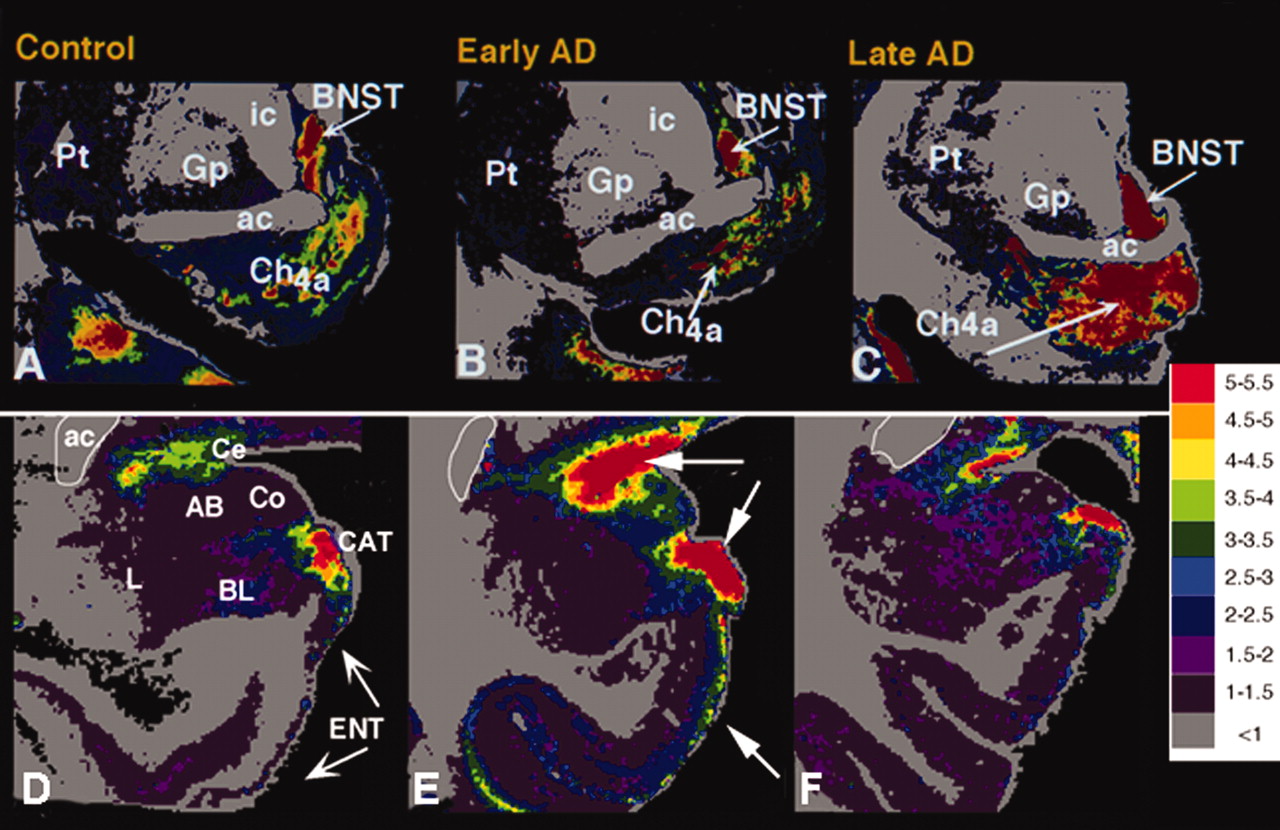
Plasticity of GAL binding sites in early and late stage AD. Autoradiograms showing the regional distribution of [125I]-hGAL binding to GALRs in the aged control (A, D) brain as compared to early (B, E) and late stage (C, F) Alzheimer disease. Pseudocolor density maps show changes in [125I]-hGAL labeling in the basal forebrain (A–C), entorhinal cortex (D–F), and amygdala (D–F) during the progression of the disease. There is an increase in labeling in the anterior subfield of the nucleus basalis in late AD (compare C with A and B). In contrast, the entorhinal cortex displays increased expression of GAL binding only in early AD (compare E with D and F). Likewise, GAL binding increases dramatically in the central nucleus and cortico-amygdaloid transition area of the amygdala in early AD and returns to levels similar to controls by late AD. AB, accessory basal nucleus of the amygdala; ac, anterior commissure; BL, basolateral nucleus (amygdala); BNST, bed nucleus of the stria terminalis; CAT, cortico-amygdaloid transition area; Ce, central nucleus (amygdala), Ch4a, anterior cholinergic cell groups of the nucleus basalis; Co, cortical nucleus (amygdala); ENT, entorhinal cortex; Gp, globus pallidus; ic, internal capsule; L, lateral nucleus (amygdala); Pt, putamen. Colorimetric scale (inset) correlates pseudocolor density with [125I]-hGAL binding density.

