- Institution: Stanford Univ Med Ctr Lane Med Lib/Periodical Dept/Rm L109
- Sign In as Member / Individual
The Environmental Genome Project
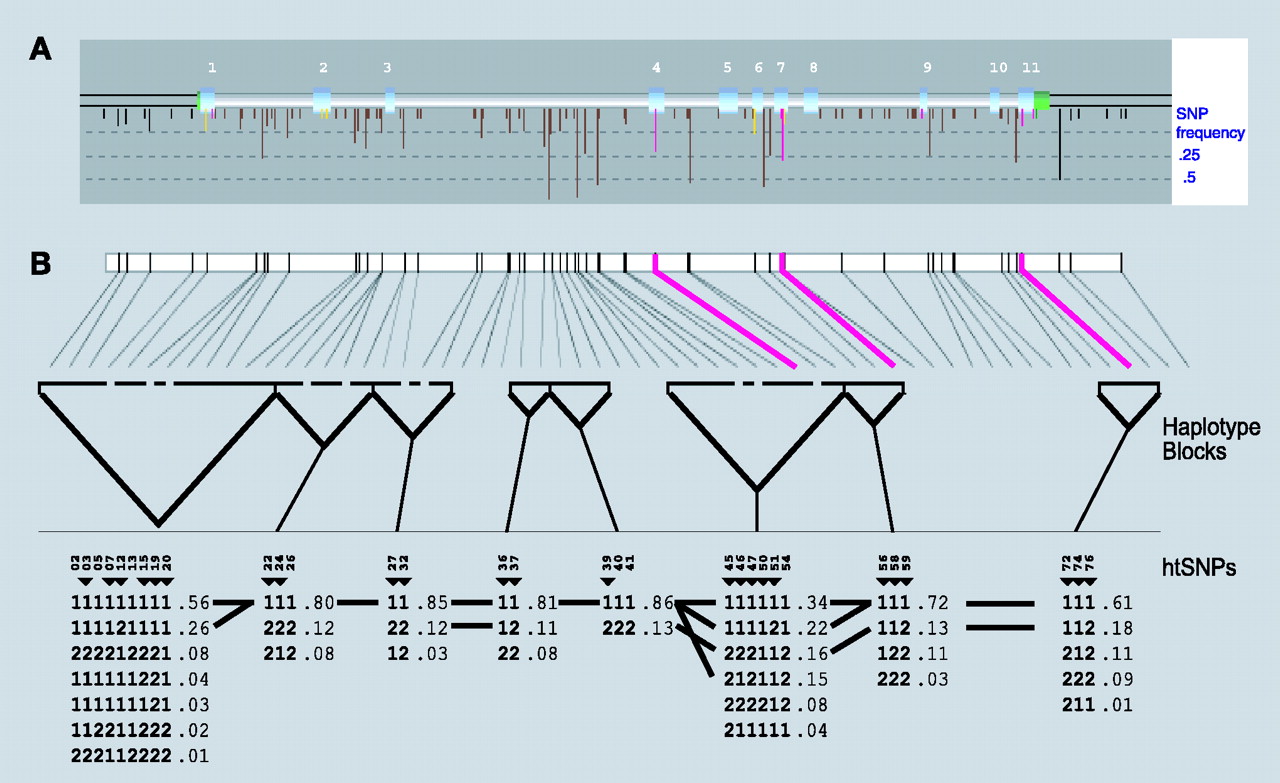
A GeneSNPs view of the methylenetetrahydrofolate reductase (MTHFR) gene. A. The MTHFR-encoding gene represents a typical EGP gene, in terms of size and nucleotide diversity, that has been scanned for polymorphism discovery. MTHFR has eleven exons (light blue indicates protein-coding and green indicates untranslated (UTR) sequences). For this gene, 15 kb was scanned for polymorphisms, which includes sequences 5′ to the first exon (~1.7kb) and 3′ of the last exon (~1.5 kb), by amplifying ninety U.S.-representative DNA samples using nineteen overlapping amplicons. Vertical descending lines represent SNPs identified in this sequence; the length of these vertical lines represents the frequency of the minor allele, and the color indicates whether the SNP location is in flanking (black), intronic (brown), synonymous (yellow), non-synonymous (red), or UTR (green) sequences. B. The structure of haplotype blocks along the MTHFR gene sequence is generated using the default algorithm from Gabriel et al. (31). For this gene, the algorithm partitions the SNPs with minor (>2%) allele frequencies into eight discrete blocks of linkage disequilibrium. Within each haplotype block are indicated the haplotypes, with the major and minor allele represented by a “1” or “2,” respectively. Population frequencies (>1%) are shown next to each haplotype block, and lines show the most common (>10%) recombination events between blocks. Marker numbers are shown across the top, with haplotype-tagging SNPs (htSNPs) highlighted with a triangular pointer.

