- Institution: Stanford Univ Med Ctr Lane Med Lib/Periodical Dept/Rm L109
- Sign In as Member / Individual
Twenty Years of Calcium Imaging: Cell Physiology to Dye For
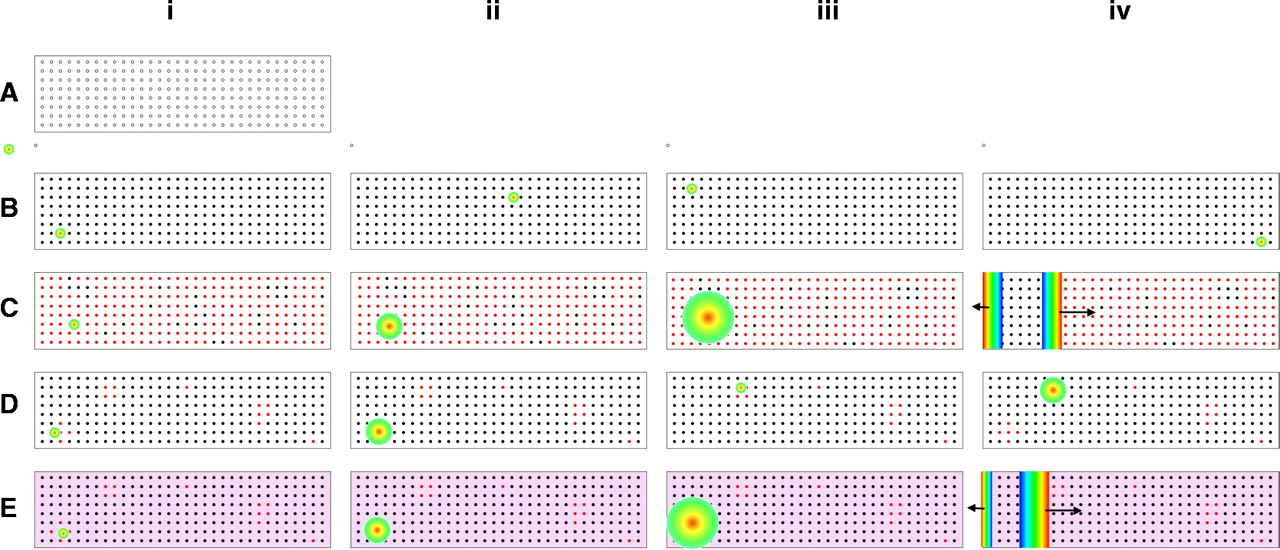
Effects of spatial heterogeneity of SR Ca2+content. A. Diagram of the cross-section of a cell with the SR Ca2+ release sites (or jSR or Ca2+ release “units”) represented as open circles. B. Time sequence (i–iv) of [Ca2+]i images of control heart cell with normal Ca2+ load in the jSR represented as black filled circles. Ca2+ sparks occur at a low rate and do not trigger other Ca2+ sparks or Ca2+ waves. C. Time sequence of [Ca2+]i images of a cell with global Ca2+ overload. The jSR sites with elevated Ca2+ content are represented as red filled circles. Ca2+ sparks can trigger neighboring jSR to produce a propagating wave of elevated [Ca2+]i. D. Time sequence of [Ca2+]i images of a cell with heterogeneously elevated Ca2+ in SR (red filled circles) mixed with jSR regions with normal or low Ca2+ content (black filled circles). Within contiguous regions of elevated SR Ca2+, aborted Ca2+ waves may occur but propagated waves do not normally traverse the cell. E. The same jSR Ca2+ load heterogeneity as in panel D but with increased sensitivity of the RyRs (See text). Under these conditions, a Ca2+ spark can initiate a Ca2+ wave.

