- Institution: Stanford Univ Med Ctr Lane Med Lib/Periodical Dept/Rm L109
- Sign In as Member / Individual
REGULATION OF DRUG TRANSPORTERS: DURING INFECTION AND INFLAMMATION
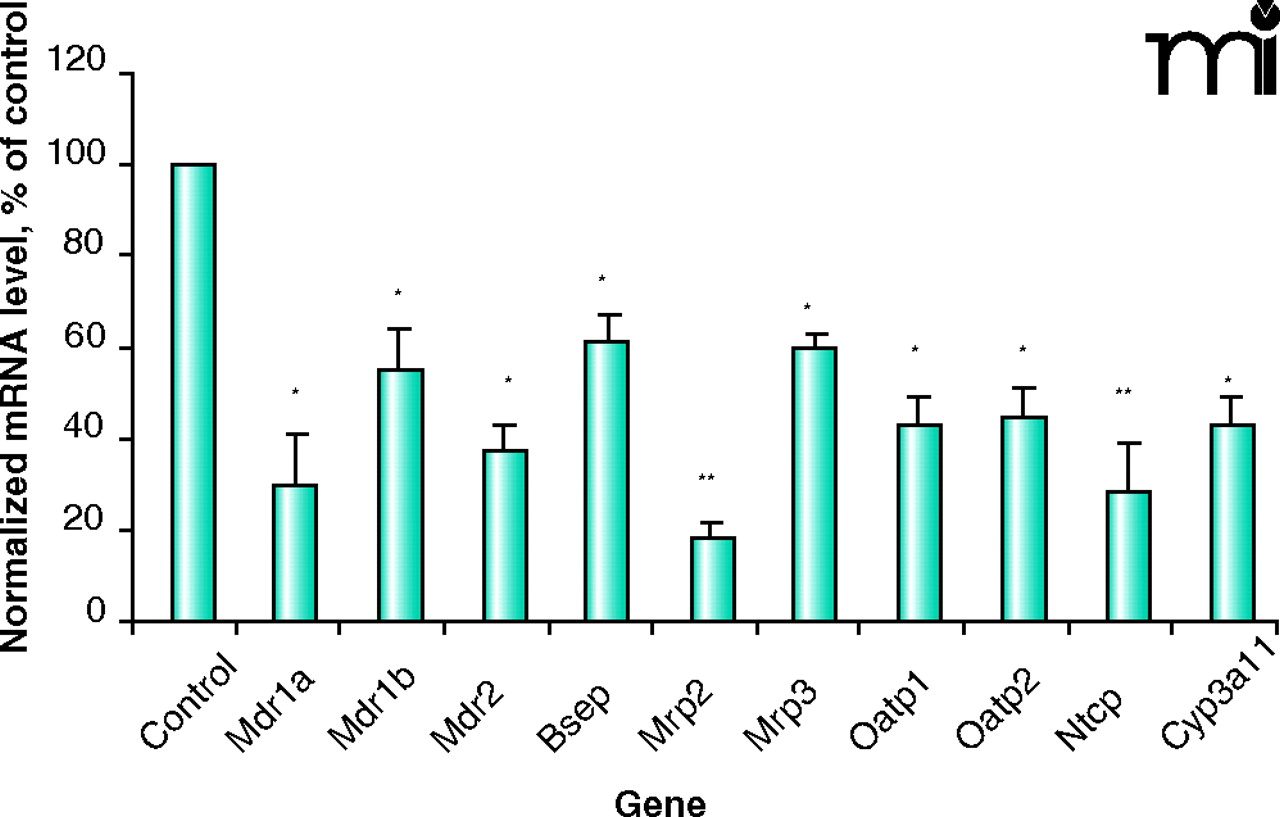
Figure 3.
Effect of endotoxin on mouse mRNA. Representative graph showing the effect of endotoxin treatment on murine hepatic transporter mRNA expression. Results reproduced from (45, 55) (Mdr1a, Mdr1b, and Oatp1), and (60) (Mdr2, Bsep, Mrp2, Mrp3, Oatp2, Ntcp, Cyp3a11). Mice (n = 4–6), injected (ip) with saline (control) or 5 mg/kg endotoxin (LPS), sacrificed six hours post-treatment. Bars represent normalized mean values ± S.E.M., as a percentage of control value. ©2002, 2005. Used with permission by The American Society for Pharmacology and Experimental Therapeutics.

