|
 
 |
| ORIGINAL ARTICLE |
|
| Year : 2015 | Volume
: 3
| Issue : 1 | Page : 22-28 |
|
Skeletal frame-size variations in adolescent female Nigerian school children in Lagos
Mike N Ibeabuchi, Smart I Mbagwu, HA Omotayo, TA Olayemi, J Aniah
Department of Anatomy, College of Medicine, University of Lagos, Lagos, Nigeria
| Date of Web Publication | 13-Jul-2015 |
Correspondence Address:
Mike N Ibeabuchi
Department of Anatomy, College of Medicine, University of Lagos, Lagos
Nigeria
 Source of Support: None, Conflict of Interest: None  | Check |
DOI: 10.4103/2315-7992.160746

Introduction: Limited information is available about the skeletal frame size of urban-dwelling adolescent female West African children. Aim and Objective: This study assessed variations in skeletal frame-size as estimated from the truncal breadths of adolescent female Nigerian children from two different socioeconomic backgrounds in Lagos. Materials and Methods: Anthropometric measurements of biacromial, bi-iliocristal, bitrochanteric, and chest breadths were taken from 320 adolescent female school children aged 10-17 years selected from public and private schools in Lagos using a systematic random method. The socioeconomic status (SES) of the subjects was classified on the basis of attendance at either fee-paying private or non-fee-paying public schools. Results: The range of skeletal breadth measurements were as follows: Biacromial breadth 32.24 ± 2.01 cm to 34.23 ± 1.35 cm; bi-iliocristal breadth 22.46 ± 1.07 cm to 23.75 ± 1.47 cm; bitrochanteric breadth 24.47 ± 2.22 cm to 28.29 ± 2.10 cm; and chest breadth 18.43 ± 2.14 cm to 19.71 ± 0.75 cm. Statistically significant differences were observed in the mean biacromial, bi-iliocristal, bitrochanteric, and chest breadths between age-matched private school girls (PRG) and public school girls (PUG). Conclusion: The observed variations in skeletal frame size among female adolescents may reflect a complex interaction between lifestyle and biological variables existing in this population, suggesting a morphologic uniqueness among the adolescent females of Lagos that calls for further systematic investigation. Keywords: Adolescent, females, Lagos, skeletal frame, truncal breadths
How to cite this article:
Ibeabuchi MN, Mbagwu SI, Omotayo H A, Olayemi T A, Aniah J. Skeletal frame-size variations in adolescent female Nigerian school children in Lagos. Ann Bioanthropol 2015;3:22-8 |
How to cite this URL:
Ibeabuchi MN, Mbagwu SI, Omotayo H A, Olayemi T A, Aniah J. Skeletal frame-size variations in adolescent female Nigerian school children in Lagos. Ann Bioanthropol [serial online] 2015 [cited 2018 Mar 3];3:22-8. Available from: http://www.bioanthrojournal.org/text.asp?2015/3/1/22/160746 |
| Introduction | |  |
Skeletal frame size is a description of the supportive structure of the skeleton that is used to adjust for skeletal mass and size in measures of body composition and weight. [1] As estimated from the biacromial, bi-iliocristal, bitrochanteric, and chest breadths, it provides an indication of the robustness of the truncal skeleton. The marked variation in body size observed during the adolescent period is associated with variation in the rate of biological maturation, [2] differential growth of body segments arising from changes in the sensitivity of bone growth plates to the effects of growth promoting and inhibiting factors at different periods during development, and at different sites of the skeleton. [3]
The relevance of skeletal frame size estimation in human subjects has been highlighted in anthropometric studies where body composition indices are correlated with physiological body composition measures. This is more clearly manifested in girls, where adolescence takes on a special significance as it also marks entry into the reproductive life cycle. [4]
In previous studies assessing severe and chronic malnutrition, especially in growing children where gross morphologic disturbances may occur, skeletal frame size estimates have been shown to be useful proxy estimates of relative fatness (endomorphy) and musculoskeletal robustness (mesomorphy) according to the Heath-Carter somatotype method. [5],[6] In addition, the socioeconomic background and lifestyle factors that often influence patterns of nutritional intake, and the patterns of physical activity and the other environmental stresses that affect the development of the skeletal frame appear to manifest significantly during the adolescent growth period. [7],[8],[9] In the Third World, especially among African children, the widening margin of the inequalities between the poor and the better-off appear to manifest in the varying patterns of physical growth observed among adolescent children. [10],[11],[12],[13],[14],[15]
While a recent study [16] summarized the status of the increasing body of knowledge on current frame size studies focused primarily on the young adult, information regarding the patterns of growth variation within the female adolescent age-group, upon which adult variations are predicated, is rather scanty in the literature. Further, the status of age-wise truncal skeletal frame size variation among Nigerian adolescents has scarcely been reported. The objectives of this study, therefore, were 1) to characterize the pattern of growth in skeletal frame size among male adolescent Nigerian school children using truncal breadths as indicators, 2) to compare our findings with reference data, and 3) to assess the possible influence of variations in socioeconomic status (SES) among the participants.
| Materials and methods | | |
Institutional approval for the study and consent
Ethical clearance to conduct this study was obtained from the Research Grants and Experimentation Ethics Committee of the College of Medicine of the University of Lagos (CMUL) prior to the commencement of sampling and measurements in the schools. Written approval obtained from the authorities at the Mushin Local Education District of the Lagos State Universal Basic Education Board (SUBEB) and from the authorities at the University of Lagos International School enabled access to the study participants. Strict compliance with local/institutional rules regarding consent for every individual subject was ensured. Consent was obtained from each subject who participated in the study by way of a consent form given individually to each child to provide assent by their parents. This was after the purpose and procedure of measurement had been carefully explained to them. Only those children who returned forms signed by their parents or guardians were included in the study. All participants received a guarantee of preservation of their personal space throughout the measurement exercise. Their right to withdraw, if so desired, at any stage of the study was also stated clearly to them.
Subject selection
This cross-sectional study involved 354 female volunteers aged 10-17 years selected by multistage stratified random sampling from two secondary schools, the University of Lagos International School and Oduduwa Secondary School, Mushin, according to an SES classification protocol modified from previous studies on recognized systems of classification of schools as a proxy for the SES of children.
As found from school records and the response to individualized questioning, the ethnocultural distribution of the biological parentage of the study participants indicated the percentage of same-ethnic-group Nigerians to be 61%, mixed-ethnic Nigerians to be 36%, and mixed Nigerian transnationals to represent less than 3% of the study sample. The Nigerian ethnic nationalities represented included the Yoruba, Ibo, Edo, Urhobo, Itsekiri, Ijaw, Ibibio, Efik, Annang, Igala, Hausa-Fulani, Nupe, Idoma, and Tiv. Excluded from the study were the following: Pure-breed Caucasian, African and Near East Semitic (Jewish and Arab), and Far East Asian children; the acutely ill and the physically challenged; children on any form of continuous medication; children with poor health conditions that manifested with overt signs of stunted growth or physical emaciation or excessively obese children.
Age estimation
The dates of birth of the subjects were collected from the school registers and confirmed from the participants individually. In case of an anomaly, participants were requested to confirm the dates from their parents. The decimal age of each participant was calculated by subtracting the date of birth of the subject from the date of data collection, using a decimal age calendar. All participants aged between 13.51 and 14.50 years were classified in the age group of 14 years, while those aged between 14.51 and 15.50 years were included in the age group of 15 years. The same principle was applied throughout to classify all the participants into appropriate age groups.
Anthropometry
Materials
GPM™ anthropometer (classical, standardized anthropometer) available at Rosscraft® Scientific, Canada. See photograph of complete set in [Figure 1].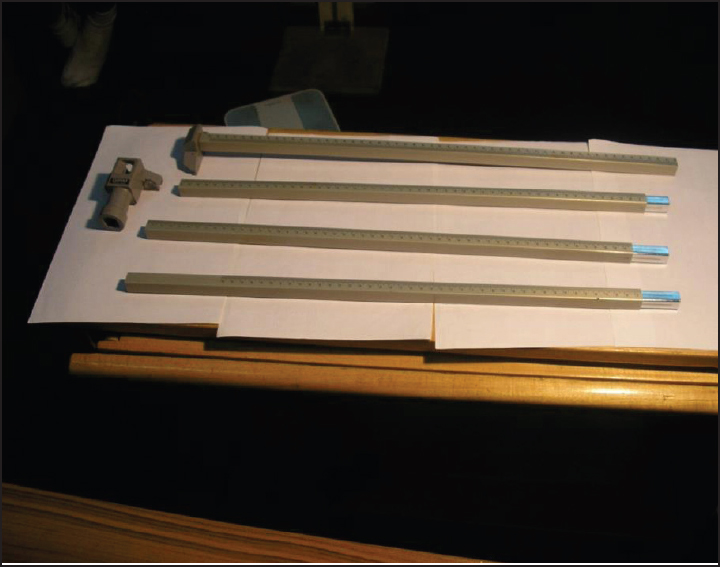 | Figure 1: Plate illustrating the complete set of the Martin GPM anthropometer
Click here to view |
Methods
The anthropometric variables measured included biacromial breadth, bi-iliocristal breadth, chest breadth, and bitrochanteric breadth, according to the protocols recommended by the International Society for the Advancement of Kinanthropometry (ISAK) later adapted for Nigerian schools, as follows.
Procedure
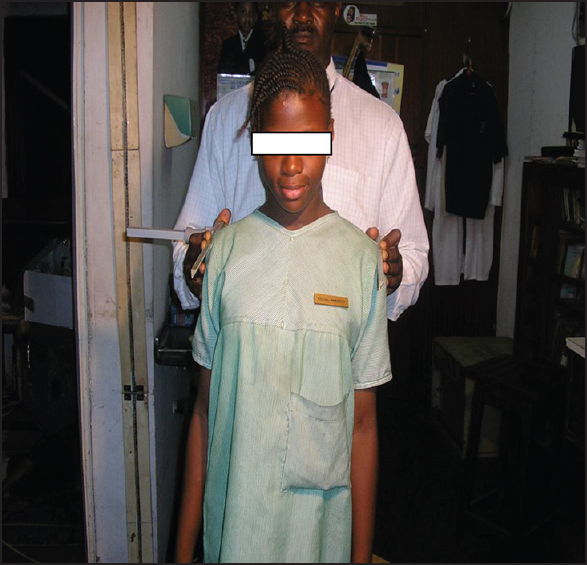
Biacromial breadth [Figure 2]
With the anthropometrist standing behind the subject and the branches of the anthropometer gripped by the thumb and the index finger and rested on the backs of the hands, biacromial breadth was measured as the distance between the most lateral points on the acromial processes when the subject stood erect with his/her arms hanging loosely at the sides. The branches of the caliper pointed upward at an angle of about 45° from the horizontal to encompass the largest diameter between the acromial processes.
Bitrochanteric breadth
With the anthropometrist standing behind the subject and the branches of the anthropometer gripped by the thumb and the index finger and rested on the backs of the hands, bitrochanteric breadth was measured as the maximum distance between the most lateral points on the greater trochanter of the left and right femurs when the subject's arms were folded over the chest.
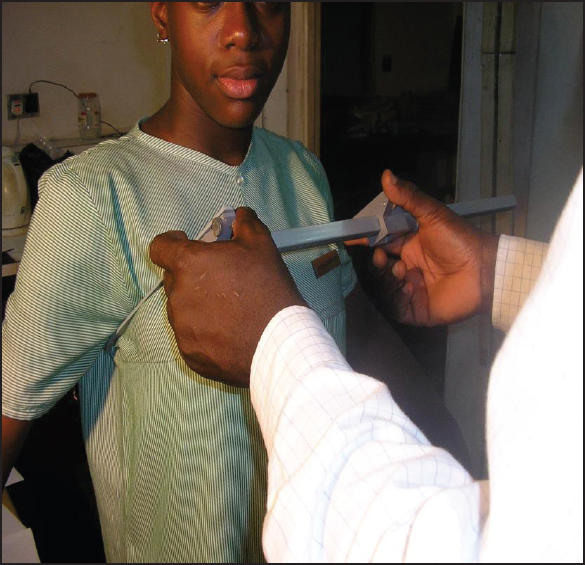
Bi-iliocristal breadth [Figure 3]
With the anthropometrist standing in front of the subject, bi-iliocristal breadth was determined as the distance between the most lateral points on the superior border of the iliac crest. The branches of the caliper pointed upward at an angle of about 45° from the horizontal to encompass the largest diameter between the lateral aspects of the iliac crests. Firm pressure was applied to the branches over the iliac sites by the anthropometrist's index fingers.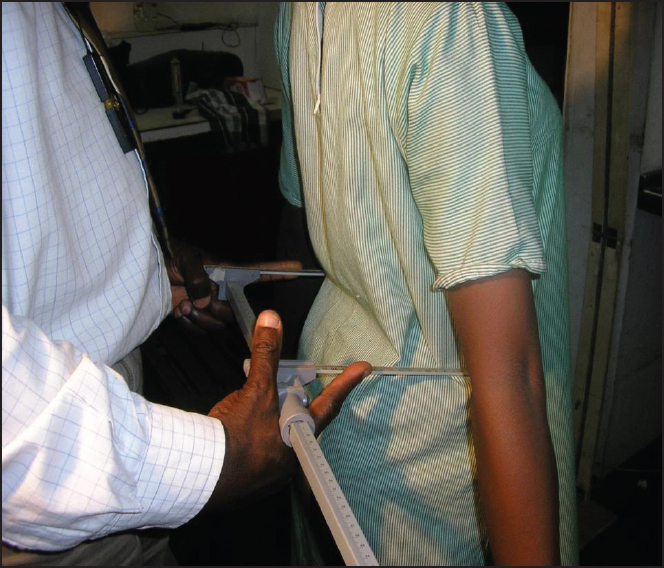 | Figure 3: Plate illustrating position of bi-iliocristal breadth measurement
Click here to view |
Transverse chest breadth
The distance of the lateral aspect of the thorax at the level of the most lateral aspect of the fourth costal cartilage was obtained by applying the large, sliding caliper to the subject, who was seated erect and facing the anthropometrist. This measurement was made at the end of the normal expiratory excursion (end-tidal) by instructing the subject to inhale, followed by exhaling fully and thereafter holding the breadth. Care was taken to apply the anthropometer (now modified as a sliding caliper) at an angle of about 30° downward from the horizontal, avoiding both the pectoral and latissimus dorsi muscle contours. With the site approximated, the anthropometrist removed the thumbs from the pinch grasp of the branches and applied firm pressure with the index fingers.
In all four situations, the scale of the anthropometer was balanced on the forearms, firm pressure being applied to the branches over the anatomical sites to compress on soft tissues, and the scale was read to the nearest 0.1 cm.
Measurement error
The validity of the skeletal frame size estimates depended on the reliability of the measurements used. To achieve quality assurance and reliability of the estimates, training of the five coauthors (Master of Science in Anatomy students) in anthropometric techniques was carried out by the first author (an ISAK-certified anthropometrist) at the Department of Anatomy, CMUL, prior to commencement of the study. Measurements were carried out in two groups of "threes," each group consisting of the following: 1) a tester, 2) an assistant, and 3) the recorder. This training ensured that all the researchers achieved an acceptable degree of reliability with estimates. Thus, the technical error of measurement (TEM), a measure of precision or replicability, was estimated to determine measurement error intrinsic to this study. The procedures, carried out both before and during the study and in strict compliance with the requirements of ISAK, are described briefly below.
Intratester TEM
Six measurements, taken by each tester on the same set of subjects, were repeated "blind." The six "pairs" of measurement, biacromial/bi-iliocristal and chest breadth/bitrochanteric breadth, were compared using the equation (4) given as follows:
TEM = [∑d2 /2n] 0.5
where d = difference between the first and second measures of each measurement used and n = number of measurement sites on the subjects. This test is the most basic indicator of the individual tester's expertise in taking precise measurements.
Intertester TEM
Six measurements were each taken by both the tester and the quality assurance person (certified anthropometrist). This "pair" of measurements was also compared using the equation given above.
The subjects, variables, and measurement procedures used for the two types of TEM were the same, and the tests had to be carried out independently. As one of the testers is a certified anthropometrist, the intertester TEM was used as a measure of accuracy. The TEM provided an estimate of the measurement error that is in the units of measurement of the variable. This value indicates that 68% of the time a measurement should fall within ± of the TEM.
Statistical analysis
All data were analyzed for mean, standard deviation (SD), and median, while the differences between independent groups were analyzed by the t-test using the Microsoft™ Excel 2010 statistical package installed on a desktop computer located in the Department of Anatomy, College of Medicine, University of Lagos.
| Results | | |
The mean, median, and SD of biacromial breadth for all age groups are presented by school type in [Table 1]. The last two columns provide comparative data from two USA databases. It shows that the differences in biacromial breadth between public school boys (PUB) and private school boys (PRB) were significant (P < 0.05) at age groups 10-12 years and 14-17 years, with a decrease at age 13 years. The results were all consistently between the fifth and 95th percentiles of the US reference data [17] and were well within ±2 SD of the National Health and Nutritional Examination Survey (NHANES III) 1988-1994 data. [18] 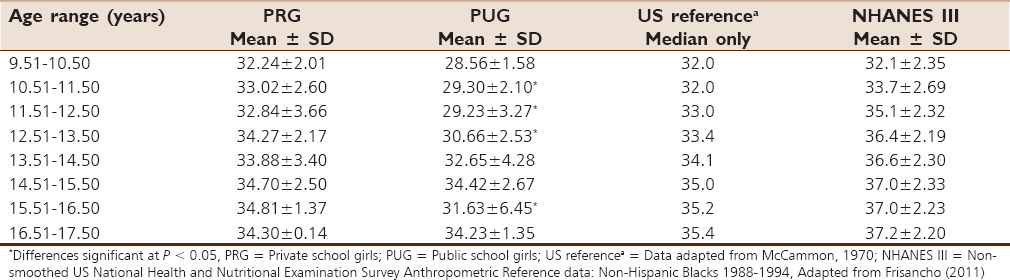 | Table 1: Summary of the descriptive and inferential statistics of the biacromial breadth (cm)
Click here to view |
[Table 2] shows the mean and standard deviation of bi-iliocristal breadth for all age groups by school type. The median values in the last column to the right provide comparative US reference data. It shows consistently and significantly greater differences in bi-iliocristal breadth between PUG and PRG (P < 0.05) at all age groups between 10 and 16 years except at age 17 years. The US reference values were not significantly greater than the mean values for the PRG except at ages 13 and 15 years. However, the results for both Nigerian study groups were between the 5 th and 95 th percentile of the US reference data. [19] 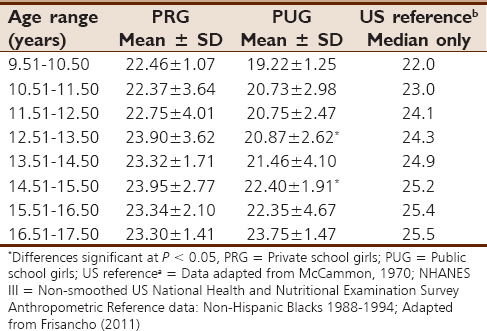 | Table 2: Summary of the descriptive and inferential statistics of the bi-iliocristal breadth (cm)
Click here to view |
[Table 3] shows the mean, median, and SD of bitrochanteric breadth for all age groups by school type. The last column to the right provides comparative US reference data. It is clear that the differences in bitrochanteric breadth between PUB and PRB were significant (P < 0.05) at all age groups from 10-16 years. They were also consistently within ±2 SD of the NHANES III 1988-1994 data as adapted from Frisancho. [18] 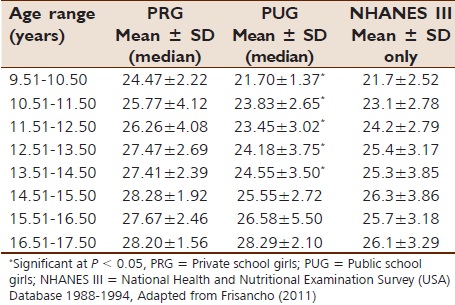 | Table 3: Summary of the descriptive and inferential statistics of the bitrochanteric breadth (cm)
Click here to view |
[Table 4] shows the mean, median, and SD of chest breadth for all age groups by school type. Chest breadth measures of the PRB increased from 10-15 years and at 17 years, while in the PUB, an increase was observed from 10-12 years and 15-17 years. Statistically significant differences were observed at ages 10 years, 12 years, and 16 years, with the PUB having a greater chest breadth.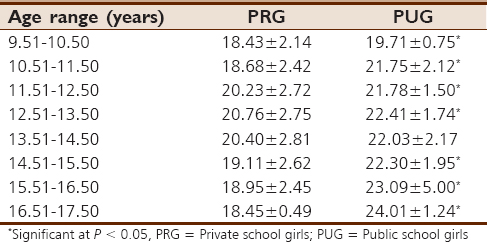 | Table 4: Summary of the descriptive and inferential statistics of the chest breadth (cm)
Click here to view |
The [Figure 1],[Figure 2],[Figure 3] and [Figure 4] show the median curves for the breadths measured, indicating the pattern of growth and variations between the two different socioeconomic backgrounds as implied by the school type across the ages of the subjects that participated in the study. The results are summarized in the tables and figures below.
| Discussion | | |
A plethora of anthropometric protocols exist in the scientific literature. [19],[20] We have adopted those recommended by ISAK [21] because of standardization, preference for it among most current authors, and the relative ease of its adaptability to the Nigerian growth-research environment. [22] Decimal age estimation principles as adapted from standardized protocols [23] enabled proper classification of all subjects in the study and reliable statistical analysis.
The nonapplicability of some of the traditional indices of SES to many developing countries has been highlighted by recent work, [24] suggesting the need to adopt simpler and easily-verifiable criteria, and the use of proxies for SES such as area of residence and the type of school attended has been reported. [25],[26] The SES of the family is often reflected in the type of school attended by the children: Economically advantaged families often prefer fee-paying private schools to minimal-fee-paying public schools because the former are better funded to provide superior educational facilities and a more positive learning environment. [26],[27]
In this study, private school girls (PRG) recorded higher mean values than their public school counterparts (PUG) in all parameters measured (bi-iliocristal, biacromial, and bitrochanteric breadths) except the chest breadth. Our data further indicated that PRG had biacromial breadth and bi-iliocristal 50th percentile values quite comparable to the USA reference group data. [18] The findings indicate that chest breadth variation follows a rather mixed pattern, with significant chest breadth variations between PRG and PUG at ages 10-12 years, followed by nonsignificant differences at ages 13-15 years, while the differences became significant again at 16 years. Given the nonavailability of international reference data to compare with, our rationalizations of the findings would only be limited to conjecture at this stage.
The bitrochanteric breadth means for both PUG and PRG lie between the fifth and 95th percentiles of the NHANES III reference data, while the 50th percentile values of our study samples are quite comparable. It may be useful to note that in the NHANES III reference data, bitrochanteric breadth is referred to as bi-iliac breadth. The graphical presentations in the figures permit graphic visualizations of the patterns of variations shown in the tables.
The variations in biacromial, bi-iliocristal, and bitrochanteric breadth observed in our study may reflect the variations associated with the onset of the adolescent growth spurt. [28],[29] The adolescent body mass (weight) spurt in girls principally includes gains in stature, skeletal tissue, and muscle mass. [30],[31] Thus, variation in this parameter would partly explain the variations in skeletal frame estimates among the study sample, as our findings also suggest that children from the lower socioeconomic background may have a higher body lean mass. However, the nonsignificance in differences suggests that aside from genetics other factors may also be at play, including physical adaptation to environment stressors. [32],[33],[34]
The age-related increments in chest breadth observed in our study are consistent with similar observations in Mexico. [35] While international norm reference data for chest breadth measurement may not be readily available at this time, [36] chest breadth was nonetheless included in our study because that measure has been shown to provide a useful indication of frame size and lean body mass and as an estimate of relative weight, and is better correlated with body mass than with stature. [37],[38]
To further explain the observed pattern of variation in chest breadth measures in our study, anecdotal evidence from the public domain suggests that in the less economically endowed neighborhoods of urban Lagos, the physical activity status of some of the study participants may contribute to the observed variation, as many children are compelled to travel considerable distances with large-rim buckets and wide basins on their heads in search of potable water. Frequent engagement in street football and street-hawking may also build up the upper trunk muscles of these children, resulting in adaptively wider chests. Other confounding factors such as maturity status, skeletal age, and body fat distribution become more pronounced with age. [39],[40] As our subjects were only classified based on differences in chronological age, there may have been a dilutional effect from mixing early- and late-maturers in the same chronological age group.
Urban Lagos is a community where the interventionist policy of colonial and postcolonial government has had a major sociocultural impact. The heterogeneous, mixed cultural and multireligious Mendelian population presents a milieu with a wide spectrum of variability, in terms of the sociocultural lifestyles, economic and living standards, and dietary habits, manifested in widely variable physiques among the children and adolescent youth, and should not be ignored as a possible explanation for the variations in skeletal frame size distribution in the area being investigated. [41],[42],[43]
| Conclusion | | |
Estimation of the skeletal frame size as a predictor of truncal shape and dimensions may indicate the future adult shape in the growing youth. This may have implications for identification of aptitude for talent in sports, fashion modeling, and the military. It may also be a predictor of adult risk factors for somatic and other disorders of possible endocrine origin. The observed variation may reflect lifestyle patterns as well as genetic variations existing in this population. The findings suggest the anthropometric uniqueness of the adolescent Nigerian females in Lagos and thus underline the need for a separate morphologic nomogram for this population. The prospect of frame size estimates as useful proxy measures of total body fat and fat-free mass where direct estimation facilities are not available has been highlighted. As there are limited data for skeletal frame size measures for this population, the findings of this study could serve as useful reference data in growth research, general clinical practice, and, where relevant, major forensic investigation.
| Acknowledgments | | |
Special thanks are due to all the Principals and Head Teachers of the schools that participated in the research. We also acknowledge the assistance rendered by various form masters/mistresses, teaching staff, and class coordinators who assisted us in the collection of data. This appreciation would not be complete without our thanking the pupils and students who graciously made themselves available for and participated in the study. This work was not funded by any organization or body.
| References | | |
| 1. | Chumlea WC, Wisemandle W, Guo SS, Siervogel RM. Relations between frame size and body composition and bone mineral status. Am J Clin Nutr 2002;75:1012-6.  |
| 2. | Siniarska A, Jeziorek A, Nowakowska M. Physical fitness of 7- to 14-year-old school children in Merida (Mexico) and Od (Poland). Med Sport Sci (Basel) 1998;43:27-43. |
| 3. | Kajantie E. Insulin-like growth factor (IGF)-I, IGF binding protein (IGFBP)-3, phosphoisoforms of IGFBP-1 and postnatal growth in very-low-birth-weight infants. Horm Res 2003;60(Suppl 3):124-30. |
| 4. | Bénéfice E, Caïus N, Garnier D. Cross-cultural comparison of growth, maturation and adiposity indices of two contrasting adolescent populations in rural Senegal (West Africa) and Martinique (Caribbean). Public Health Nutr 2003;7:479-85. |
| 5. | Slaughter MH, Lohman TG, Boileau RA. Relationship of the Heath and Carter′s second component to lean body mass and height in college women. Res Q 1977;48:759-68. |
| 6. | Ibeabuchi NM, Leko BJ, Noronha CC, Okanlawon AO. Somatotype distribution among female adolescent Nigerian school children in a private school in Lagos. Nig Q J Hosp Med 2011;21:226-30. |
| 7. | Ulijaszek SJ. The international growth standard for children and adolescents project: Environmental influences on preadolescent and adolescent growth in weight and height. Food Nutr Bull 2006:27(Suppl Growth Standard):S279-94. |
| 8. | Wardle J, Brodersen NH, Cole TJ, Jarvis MJ, Boniface DR. Development of adiposity in adolescence: Five year longitudinal study of an ethnically and socioeconomically diverse sample of young people in Britain. BMJ 2006;332:1130-5. |
| 9. | Cameron N. Human growth, nutrition, and health status in Sub-Saharan Africa. Yearb Phys Anthropol 1991;34:211-50. |
| 10. | Cameron N. The contribution of the pattern of human growth and development to adult morphological diversity in southern Africa. S Afr J Sci 1992;88:262-8. |
| 11. | Carter JE. Kinanthropometry, exercise and sports - A review. Afr J Phy Health Edu Recreat Dance 1996;2:89-101. |
| 12. | Cameron N, Gordon-Larsen P, Wrchota EM. Longitudinal analysis of adolescent growth in height, fatness, and fat patterning in rural South African black children. Am J Phys Anthropol 1998;93:307-21. |
| 13. | Mangalore R, Knapp M, Jenkins R. Income-related inequality in mental health in Britain: The concentration index approach. Psychol Med 2008;37:1037-45. |
| 14. | Soekirman, Hardinsyah, Jus′at I, Jahari AB. Regional study of nutritional status of urban primary school children. 2. West Jakarta and Bogor, Indonesia. Food Nutr Bull 2002;23:31-40. |
| 15. | Uthman OA. Using extended concentration and achievement indices to study socioeconomic inequality in chronic childhood malnutrition: The case of Nigeria. Int J Equity Health 2009;8:22. |
| 16. | Ibeabuchi NM, Mbagwu SI, Adelakun SA, Olayemi TA, Aniah J, Adeyemi O. Anthropometric variations in the frame-size of Adolescent male Nigerian school children in urban Lagos. J. Anat Sci 2014;5:39-46. |
| 17. | McCammon RB. Distance curves for biacromial breadths in American children aged 2-17 years. Human Growth and Development. Springfield, IL: Charles C Thomas; 1970. In: Malina RM, Bouchard C, Bar-Or O. Growth, Malnutrition and Physical Activity. Illinois: Human Kinetics Books; 2004. p. 68. |
| 18. | Frisancho AR. Anthropometric Standards: An Interactive Nutritional Reference of Body Size and Body Composition for Children and Adults. Ann Arbor, MI: University of Michigan Press; 2011. p. 71. |
| 19. | Malina RM, Roche AF. Manual of physical status and performance in childhood: Physical performance, Vol. 2. New York: Plenum Press; 1983. In: Malina RM, Bouchard C, Bar-Or O. Growth, Malnutrition and Physical Activity. Illinois: Human Kinetics Books; 2004. p. 68. |
| 20. | Malina RM, Bouchard C, Bar-Or O. Growth, Malnutrition and Physical Activity. Champaign, IL: Human Kinetics Books; 2004. p. 70-1. |
| 21. | International Society for the Advancement of Kinanthropometry. International Standard for Anthropometric Assessment Underdale. South Africa: ISAK; 2006. p. 21-6. |
| 22. | Ibeabuchi NM, Onabule MA, Tella BA, Roberts AA, Okanlawon AO. The relationship between blood pressure and selected anthropometric variables in male adolescent Nigerian school children in Lagos. J Med Women′s Assoc Nigeria 2006;2:39-45. |
| 23. | Marshall WA, Tanner JM. Variations in pattern of pubertal changes in boys. Arch Dis Child 1970;45:13-23. |
| 24. | Ogunlesi AT, Dedeke IO, Kuponiyi OT. Socio-economic classification of children attending Specialist Paediatric Centres in Ogun State, Nigeria. Niger Med Pract 2008;54:21-5. |
| 25. | Onwujekwe O, Hanson K, Fox-Rushby J. Some indicators of socioeconomic status may not be reliable and use of indices with these data could worsen equity. Health Econ 2006;15:639-44. |
| 26. | Prista A, Maia JA, Damasceno A, Beunen G. Anthropometric indicators of nutritional status: Implications for fitness, activity, and health in school-age children and adolescents from Maputo, Mozambique. Am J Clin Nutr 2003;77:952-9. |
| 27. | Mcmurray RG, Harrell JS, Bangdiwala SI, Bradley CB, Deng S, Levine A. A school-based intervention can reduce body fat and blood pressure in young adolescents. J Adolesc Health 2002;31:125-32. |
| 28. | Tanner, JM. Growth at Adolescence. 2 nd ed. Oxford: Blackwell Scientific Publications; 1962. In: Malina RM, Bouchard C, Bar-Or O. Growth, Malnutrition and Physical Activity. Illinois: Human Kinetics Books; 2004. p. 304. |
| 29. | Berkey CS, Wang X, Dockery DW, Ferris BG Jr. Adolescent height growth of US children. Ann Hum Biol 1994;21:435-42. |
| 30. | Iuliano-Burns S, Mirwald RL, Bailey DA. Timing and magnitude of peak height velocity and peak tissue velocities for early, average, and late maturing boys and girls. Am J Hum Biol 2001;13:1-8. |
| 31. | Malina RM, Bouchard C, Beunen G. Human growth: Selected aspects of current research on well-nourished children. Annu Rev Anthropol 1988;17:187-219. |
| 32. | Wall-Scheffler CM. Size and shape: Morphology′s impact on human speed and mobility. J Anthropol 2012;2012:1-9. |
| 33. | Miller AT Jr, Blyth CS. Lean body mass as a metabolic reference standard. J Appl Physiol 1953;5:311-6. |
| 34. | Schneider D. International trends in adolescent nutrition. Soc Sci Med 2000;51:955-67. |
| 35. | Reyes ME, Tan SK, Malina RM. Urban-rural contrasts in the growth status of school children in Oaxaca, Mexico. Ann Hum Biol 2003;30:693-713. |
| 36. | Garn SM, Pesick SD, Hawthorne VM. The bony chest breadth as a frame size standard in nutritional assessment. Am J Clin Nutr 1983;37:315-8. |
| 37. | Johnston FE, Malina RM. Correlations of midshaft breadths and compact bone thickness among bones of upper and lower extremities of children aged 6 to 16 years. Am J Phys Anthropol 1970;32:323-7. |
| 38. | Malina RM, Johnston FE. Relations between bone, muscle and fat widths in the upper arms and calves of boys and girls studied cross-sectionally at ages 6 to 16 years. Hum Biol 1967;39:211-23. |
| 39. | National Center for Health Statistics. NHANES III Reference Manuals and Reports (CD-ROM) Hyattville, MD: National Center for Health Statistics; 1996. In: Frisancho AR. Anthropometric Standards: An Interactive Nutritional Reference of Body Size and Body Composition for Children and Adults. Ann Arbor, MI: University of Michigan Press; 2011. p. 71. |
| 40. | Garnier D, Ndiaye G, Bénéfice E. Influence of urban migration on physical activity, nutritional status and growth of Senegalese adolescents of rural origin. Bull Soc Pathol Exot 2003;96:223-7. |
| 41. | Leonard WR, Crawford MH. Human Biology of Pastoral Populations. New York: Cambridge University Press; 2002. In: Ibeabuchi NM. Morphologic Characterization and Somatotypes of Nigerian Adolescent School Children in Urban Lagos. Unpublished PhD thesis. Lagos, Nigeria: University of Lagos; 2008. p. 63. |
| 42. | Hedrick PW. Genetics of Populations. In: Ibeabuchi NM, editor. 2nd ed. Sudbury, MA: Jones and Bartle; 2000. Morphologic Characterization and Somatotypes of Nigerian Adolescent School Children in Urban Lagos. Unpublished PhD thesis. Lagos, Nigeria: University of Lagos; 2008. p. 36. |
| 43. | Ibeabuchi NM. Morphologic Characterization and Somatotypes of Nigerian Adolescent School Children in Urban Lagos. Unpublished PhD thesis. Lagos, Nigeria: University of Lagos; 2008. |
[Figure 1], [Figure 2], [Figure 3], [Figure 4]
[Table 1], [Table 2], [Table 3], [Table 4]
|


 Search Pubmed for