|
 
 |
| ORIGINAL ARTICLE |
|
| Year : 2016 | Volume
: 4
| Issue : 1 | Page : 20-25 |
|
Determination of handedness: An anthropometric evaluation of the glenoid cavity
GS Oladipo, EO Aigbogun, LG Akani
Department of Anatomy, College of Health Sciences, University of Port-Harcourt, Choba, Rivers State, Nigeria
| Date of Web Publication | 13-Sep-2016 |
Correspondence Address:
G S Oladipo
Department of Anatomy, College of Health Sciences, University of Port-Harcourt, PMB 5323 Choba, Rivers State
Nigeria
 Source of Support: None, Conflict of Interest: None  | Check |
DOI: 10.4103/2315-7992.190463

Background: The search for suitable parameters that defines handedness from skeletal remains a concept yet to be achieved. This has created postulations and theories of guess and noninvestigative proofs. Anthropometric parameters provide insight on the variation that exists between anatomical structures. Such variations may also exist between the two sides of a bone. Aims: This study was therefore aimed at determining the anthropometric relationship and variation between the right and left sides of the glenoid cavity of the scapula and its implication in forensic medicine. Materials and Methods: This study drew samples from 173 nondeformed, well-macerated scapulae bones comprising 75 right (R) and 98 left (L) of undetermined sex and age; obtained from the Department of Human Anatomy at various institutions in South-South Nigeria. Two anthropometrical parameters were measured from the glenoid cavity using sliding digital caliper calibrated to 0.00 mm. The measured dimensions included maximum glenoid height (MGH), maximum glenoid width (MGW), and the glenoid index (GI) was calculated by dividing MGW by MGH. SPSS Version 20 was used to analyze the obtained data. Results: The mean ± standard deviation of the MGH was 36.87 ± 3.94 mm (R = 37.71 ± 4.24 mm, L = 36.22 ± 3.58 mm); MGW was 25.15 ± 3.60 mm (R = 26.20 ± 3.30 mm, L = 24.35 ± 3.64 mm). Statistical analysis using ANOVA and t-test showed the MGH (t = 2.444, P = 0.016) and MGW (t = 3.941, P< 0.01) were observed to be significantly greater in the right side. The GI was calculated as 0.682 ± 0.059; the right side (0.696 ± 0.055) was significantly smaller than the left (0.671 ± 0.060). Conclusion: The evidence from this study can be an indication of kinanthropological application of the scapula; in which a side is most frequently used than the other (handedness). The result of this study can aid in decision making; in the reconstruction of damaged skeletal part, an identification which can be partial or complete and biological profiling. Recommendation: We believe that the validation of this finding is vital; hence, a larger sample from different regions should be studied as to reach significant conclusions. Keywords: Anthropometry, glenoid index, handedness, South-Southern Nigeria
How to cite this article:
Oladipo G S, Aigbogun E O, Akani L G. Determination of handedness: An anthropometric evaluation of the glenoid cavity. Ann Bioanthropol 2016;4:20-5 |
| Introduction | |  |
Byers [1] stated that there are five other goals of the forensic anthropologist; establishing the decedent's biological profile, finding evidence of trauma, determining the length of the postmortem interval, recovering the decedent from the forensic site, and providing information to assist with a positive identification of the decedent. The four components of the biological profile include age, sex, ancestry, and stature. These four factors are important to law enforcement officials as they aid in the ability to positively identify human skeletal remains.[2]
The search for suitable parameters that defines handedness from skeletal remains; still remains a concept yet to be practicalized. Forensic anthropologists [2],[3] have investigated the scapula and long bones extensively using both standard length and transverse dimensions of the scapula, clavicle, humerus, ulna, and radius for individuals of known handedness on the assumption that arm bones on the side of handedness will be larger, but these attempts have proven limited as concerns of replicability of methods has surmounted the course. Handedness may be defined as the consistently preferred use of one limb over the other.[4] As described by Kreierhoff,[5] the term “handedness” was employed by psychologists to refer to the categorization of one of the upper limbs as dominant. Handedness in biological profiling of an individual from skeletal remains cannot be overemphasized. However this is close to impossible, knowing that one cannot simply tell if an individual is left- or right-handed simply by looking at their hands, as the limbs of a living person generally appear to be identical in shape, structure and composition.[6] According to Steele,[7] handedness is also an indicator of brain lateralization, or the asymmetry in brain growth and function, in that “asymmetry of neocortical structures are associated with hand preference.”
Handedness can be measured either from the perspective of one hand being more skilled than the other or from a person's individual preference as to which hand to use for different tasks.[7] The latter measurement, of which, takes into account both biological preference due to skill and the influence of external factors such as the environment and cultural practices. Interest in the research of handedness of skeletal remains stems from three main fields of study (evolutionary anthropology, cultural archaeology, and forensics).[4] Theoretical explanations for handedness have been explored by various researchers; Cashmore [8] explained that dominance was recognized as the side used for performing intricate motor activities, and also the side which showed greatest “hand skill.” Hand skill was defined as the completion of a fine-motor task quickly and efficiently. Danforth and Thompson [3] hypothesized that skeletal morphology is shaped based on the stress placed upon it. Braccini et al.[9] recapitulated evolutionary trends and stated that increase in “absolute handedness” as a result of increasing bipedality is the foundation for the postural origins theory of human handedness with approximately 90% right-hand bias. The results of these studies imply that the transition to a bipedal lifestyle may have provided the opportunity for the lateralization of handedness to evolve as well.[10] The above theories render the traditional definition of handedness irrelevant. In situ ations as this, the definition of handedness has become rather uncertain, incompletely referring to the longer or stronger limb as shown by measurements of bone length, density, and resistance to torsion.
The glenoid cavity (G. socket) is a shallow pyriform,[11] articular fossa located on the lateral angle of the scapula which gives an articular surface and sitting for the head of the humerus. The shape of the glenoid cavity and glenoid labrum which deepens it and aids its stability; giving the humerus a wide range of movement, thus making it the most mobile joint in the body.[12] The processes of scapular development and ossification are highly variable between individuals. Individuals may experience differential rates of ossification, and some individuals will never experience full fusion of the acromial process to the scapula, a condition called os acromiale.[2]
Campobasso et al.[13] used the same seven measurements (maximum length, maximum breadth, and maximum distance between the acromion-coracoid processes, the maximum length of the acromion and the coracoid processes, length and breadth of the glenoid cavity) as Di Vella et al.[14] in an attempt to use regression formulae to estimate stature. Using a sample of 80 modern Southern Italian adults separated by sex, Campobasso et al.[13] found that the best linear regression formulae for predicting living height from measurements of the scapula came from the maximum breadth and width of the glenoid cavity for males, and the maximum length of the coracoid and the width of the glenoid cavity for females. Their study is significant because it shows how fragments and incomplete bone may be used to estimate height in forensic investigations. Bainbridge and Santiago,[15] Di Vella et al.,[14] and Snow [16] all attempted sex differentiation from archaeological scapulae bone which indicated a significant difference with 95% accuracy of discrimination recorded by Di Vella et al.;[14] their result showed no significant influence of sex on stature which was surprising according to Burke.[2]
Anthropometric determination of the extent of variation existing between the right and left scapulae is essential in corroborating other studies or finding new practical explanations to handedness with clearly explained rationale. This study, therefore, investigates (by use of simple anthropometric measurement) the level of variation that exists between the left and the right glenoid cavity of the scapulae in the bid to substantiate the possibility of determining handedness from skeletal remains of Nigerian origin.
| Materials and Methods | | |
A total of 173 nondeformed macerated scapulae bones comprising of 75 (43.4%) right (R) and 98 (56.6%) left (L) of undetermined sex and age were collected from the Department of Human Anatomy of various institutions in South-South Nigeria. The scapulae were fully developed, unidentified and unpaired but of adult Nigerians. According to Gray et al.,[12] Stevenson [17] and Schwartz;[18] in most individuals, the scapula is not fully developed until the early to mid-20 s; hence, well-developed scapulae will indicate that they were all adult samples.
Exclusion and inclusion criteria
Bone pairing was not considered and all deformed and poorly macerated scapulae (lots of soft tissues on the bone) were excluded from the study population.
Contributing institutions
The following institutions granted us access to their anatomy museums and only samples that met the criteria were obtained. Contributions made included; 55 scapulae from University of Benin, 47 from the University of Calabar, 10 from Niger Delta University, 47 from the University of Port Harcourt, and 15 from University of Uyo.
Data collection
The scapulae were tightly held in anatomical position by a standing clamp; with the lateral border and the glenoid cavity facing anteriorly. Data were collected in line with measurements protocol by Campobasso et al.[13] Using a sliding digital calliper calibrated to 0.00 mm, two anthropometrical parameters were measured from the glenoid cavity. The measured dimensions included maximum glenoid height (MGH), maximum glenoid width (MGW), and the glenoid index (GI) was calculated by dividing MGW by MGH.
In view to Limit reader's error, measurements were repeatedly taken (twice) and the average recorded as the value for each scapulae measured.
Landmarks and guidelines for measurements
Maximum height of glenoid fossa [Figure 1], line g and h]: Maximum distance between the superior border and the inferior border of the glenoid fossa. The MGH is an adjourning line from g to h.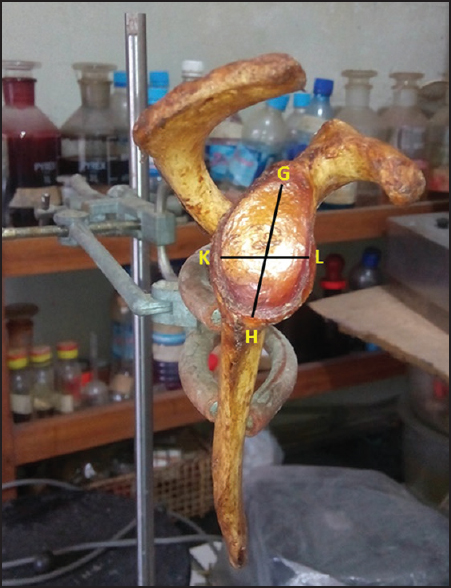 | Figure 1: The landmark of the measured glenoid dimensions (line GH; Maximum glenoid Height, GW; Maximum Glenoid Width. Glenoid Index (GI)=GW/GH
Click here to view |
Maximum breadth of glenoid fossa [Figure 1], point k and l]: Maximum distance between the ventral border and the dorsal border of the glenoid, usually around the midpoint of the glenoid fossa. The MGW is an adjourning line from k to l.
Statistical analysis
IBM® Statistical package for social sciences (SPSS, Version 20) ANOVA and unpaired t-test was used in assessing the side differences in the measured dimensions.
| Results | | |
The values observed were tabulated and the mean value and range were calculated for both side of the glenoid cavity [Table 1]. The ANOVA and t-test was used to compare the mean difference in the values obtained for the sides [Table 2] and the comparison with other study documented in [Table 3].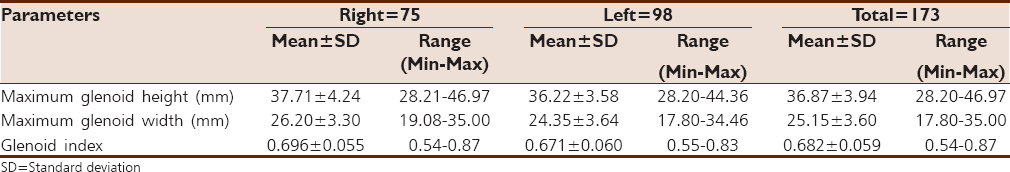 | Table 1: Descriptive characteristics of the glenoid cavity of the scapula
Click here to view |
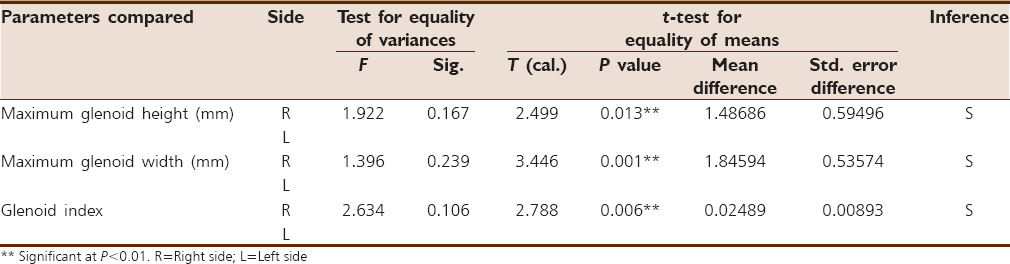 | Table 2: Analysis of variance and mean difference in the sides of the medial angle
Click here to view |
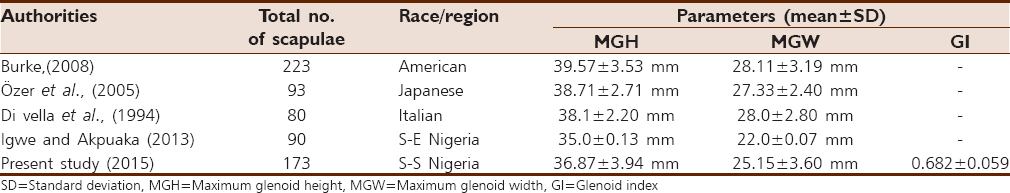 | Table 3: Non-statistical comparison of medial angles of scapula with earlier studies
Click here to view |
Right and left scapulae
From [Table 1], the values obtained are as follows:
The mean (standard deviation [SD]) value of the MGH was found to be 36.87 ± 3.94 mm with the range value found to be between 28.20 and 46.97 mm, the right scapula mean (SD) was found to be 37.71 ± 4.24 mm while the left was found to be 36.22 ± 3.58 mm.
The mean (SD) of the MGW was found to be 25.15 ± 3.60 mm. The range was found to be 17.80–35.00 mm; thus, the right scapula means (SD) was found to be 26.20 ± 3.30 mm while the left mean (SD) was found to be 24.35 ± 3.64.
The mean (SD) value of GI of the scapula was calculated as 0.682 ± 0.059. The range was found to be 0.54–0.87. For the right scapula, the mean (SD) was found to be 0.696 ± 0.055 while the left mean (SD) was found to be 0.671 ± 0.060.
Analysis of variance and mean difference
The variation that existed between the variable was negligible (P > 0.05) and mean difference observed for R and L scapula for all parameters were statistically significant. The mean difference (SE) for the MGH was found to be 1.487 (0.608) mm (t = 2.444, P = 0.016), the MGW was found to be 1.846 (0.529) mm (t = 3.491, P = 0.001) and the mean difference (S.E) between the left and right G.I was found to be 0.025 (0.0089) with t = 2.788 and P < 0.01.
| Discussion | | |
Larson [19] and Alemseged et al.[20] stated that glenoid fossa size can be estimated by two measurements: The fossa's breadth and length. These two parameters can be used to approximate body size in specimens of unknown weight and stature.[19],[20] Kreierhoff [5] also noted the orientation of the glenoid cavity by examining the angle between the glenoid cavity and scapular spine, the angle between the glenoid cavity and the lateral border, and the angle between the glenoid cavity and medial border. The glenoid cavity served as a stationary point of scapular anatomy, which enabled one make observations based on scapular changes in relation to the glenoid.[5] Osteological convention as described by Buikstra and Ubelaker [21] states that the left side of a skeletal pair should be measured, unless unavailable or damaged, in which case, the right side should be assumed equivalent and measured in its stead. The above convention gives room for pairwise comparison of corresponding right and left Scapulae. Steele and Mays [22] stated that directional asymmetry is the process of interest for determining handedness and occurs when a trait undergoes greater development on one side of the plane of symmetry. Steele [7] suggested that consistent hand preference leads to lateral asymmetry in mechanical loading. Therefore we can detect handedness by studying these right-left differences.
In this study, the MGH and MGW for the South-South Nigerian population were lower than the results of Burke [2] for American, Özer et al.[23] for Japanese and Di vella et al.[14] for the Italian population but higher than South-East Nigerian population documented by Igwe and Akpuaka.[24] The values obtained for the GI for the South-South population is an indication that the glenoid cavity is more “oval” in shape with a larger height to width ratio. To the best of our search, there were no available comparative data for the GI of other populations.
Little or no literature were found on the use of anthropometry to establish handedness. However, available literatures mainly investigated the morphological variation between some variables of the right and the left sides of the scapula which can influence differentially the anatomical features of the scapula and thus suggest handedness. Gray et al.[12] in the study of native American skeletons from burial mounds found variation within the shape of the acromion and the glenoid fossa. Gray et al. attributed many of these variations of the scapulae features and morphology to handedness. Hoppa [25] utilizing the osteological convention in his study on human skeletal growth; also noted the mean differences between the available right and left pairs in order to rule out skeletal asymmetries as an issue that may affect the outcomes and interpretation of the study.
In this study, the explanation for handedness, particularly in adults, may be due to kinathropological application, which can simply be described as the choice of use of one side of the hand over the other. The values obtained for the right were significantly higher than those of the left; indicating that constant/varied range of movement at the shoulder as a result of hand preference may have played substantial roll. It would be agreed that friction generated between two rubbing surfaces (over a period of time) results in wearing (widening and deepening of the surfaces in contact); which is a nonpathological effect. This by implication would mean that the physiologic effect (wearing) will be felt more on the part most frequently used in carrying out activities and kinathropologically, it could be suggestive of sustained use as a result of handedness.
Lots of scientist may argue the fact that the use of the hand is from the wrist down to the phalanges but critical observation of the activities of man has shown that the “hand alone” only contributes to <15% of its activities with majority of its use influenced by the entire forelimb; particularly at the shoulder joint. This is corroborated in the description of handedness by Corballis,[6] Pandovini,[4] and Kreierhoff.[5] The observed difference between the left and right (wider and higher values for the right) glenoid cavity emphasizes the 90% right-hand bias on the assumption that most individuals are right-handed. This reinforces the postural origins theory of human handedness by Braccini et al.[9] The findings of this study questions the aspect of brain control of handedness as it accentuates the existence of difference between the left and right glenoid cavity based on the “theory of use and disuse.” Nevertheless, the completeness of this research lies in questions that must be answered; then it would be accurate to claim that the glenoid cavity is the best determinant for handedness. Such questions are:
- Is the difference observed in the glenoid cavity a result of neuroembryological initiation to accommodate the use of the particular limb?
- Is the difference as a result of frequent use of that particular limb which could have increased the dimensions of the glenoid cavity?
| Conclusion | | |
The evidence (higher values for the right) from this study could be an indication of kinanthropological application of the upper limb; in which a side is most frequently used than the other (handedness or limb preference). However, lots of comparative study on hand preference needs to be investigated for a precise conclusion about handedness.
Recommendation for further studies
The answer from either of the two questions above leads to the recommendation for further studies on three broad aspects.
- The radiologic difference between the sides of the developing glenoid cavity
- Differential growth pattern of the glenoid cavity dimensions (comparing children and adolescents to adults)
- The radiologic difference of the glenoid cavity of the amputees and normal individuals.
Financial support and sponsorship
Nil.
Conflicts of interest
There are no conflicts of interest.
| References | | |
| 1. | Byers SN. Introduction to Forensic Anthropology. 2 nd ed. Boston: Allyn and Bacon, Inc.; 2005.  |
| 2. | Burke RM. Can we Estimate Stature from the Scapula? A Test Considering Sex and Ancestry (An MSc Thesis). Submitted to the Graduate Faculty of the Louisiana State University and Agricultural and Mechanical College. Department of Geography and Anthropology; 2008. |
| 3. | Danforth ME, Thompson A. An evaluation of determination of handedness using standard osteological measurements. J Forensic Sci 2008;53:777-81. |
| 4. | Pandovini M. Skeletal Asymmetries and their Implications towards the Determination of Handedness (An MSc. Dissertation). Human Osteology and Funerary Archaeology. University of Sheffield; 2011. |
| 5. | Kreierhoff JL. Knuckle-Walking Signatures in Hominoid Scapulae (An MSc Thesis). Kent State University; 2014. |
| 6. | Corballis MC. Human Laterality. London: Academic Press; 1983. |
| 7. | Steele J. Handedness in past human populations: Skeletal markers. Laterality 2000;5:193-220. |
| 8. | Cashmore L. Can hominin 'handedness' be accurately assessed? Ann Hum Biol 2009;36:624-41. |
| 9. | Braccini S, Lambeth S, Schapiro S, Fitch WT. Bipedal tool use strengthens chimpanzee hand preferences. J Hum Evol 2010;58:234-41. |
| 10. | Zachwieja AJ. Assessing Handedness: A Review of Methodology and Implications for the Fossil Record. University of Illinois at Urbana-Champaign, Anthropology Department, 2012. |
| 11. | Moore KL, Dailey AF. The Upper Limb: Clinically Oriented Anatomy. 5 th ed. Philadelphia, PA: Lippincott Williams and Wilkins; 2006. p. 726-886. |
| 12. | Gray H. Anatomy, Descriptive and Surgical. In: Pick PT, Howden R, editors. 15 th ed. New York: Bounty Books. 1977. |
| 13. | Campobasso CP, Di Vella G, Introna F Jr. Using scapular measurements in regression formulae for the estimation of stature. Boll Soc Ital Biol Sper 1998;74:75-82. |
| 14. | Di Vella G, Campobasso CP, Dragone M, Introna F Jr. Skeletal sex determination by scapular measurements. Boll Soc Ital Biol Sper 1994;70:299-305. |
| 15. | Bainbridge D, Santiago GT. A study of the sex differences in the scapula. J R Anthropol Inst GB Irel 1956;86:109-34. |
| 16. | Snow FJ. Geometric Morphometry Analysis of the Scapula: Implications for the Determination of Sex and Ancestry. Ph.D. Dissertation, Department of Anthropology, University of Tennessee; 2004. |
| 17. | Stevenson PH. Age Order of Epiphyseal Union in Man. Am J Phys Anthropol 1924;7:53-93. |
| 18. | Schwartz JH. Skeleton Keys: An Introduction to Human Skeletal Morphology, Development, and Analysis. 2 nd ed. New York: Oxford University Press; 2007. |
| 19. | Larson SG. New characters for the functional interpretation of primate scapulae and proximal humeri. Am J Phys Anthropol 1995;98:13-35. |
| 20. | Alemseged Z, Spoor F, Kimbel WH, Bobe R, Geraads D, Reed D, et al. A juvenile early hominin skeleton from Dikika, Ethiopia. Nature 2006;443:296-301. |
| 21. | Buikstra JE, Ubelaker DH. Standards for Data Collection From Human Skeletal Remain. Arkansas Archaeological Survey Research Series No. 44; 1994. |
| 22. | Steele J, Mays S. Handedness and directional asymmetry in the long bones of the human upper limb. Int J Osteoarchaeology 1995;5:39-49. |
| 23. | Özer I, Katayama K, Sahgir M, Güleç E. Sex Determination Using the Scapula in Medieval Skeletons from East Anatolia. Collegium Antropologicum 2006;30(2):415-9. |
| 24. | Igwe M, Akpuaka FC. Stature estimation from measurement of scapula of South-East Nigeria. J Exp Res 2013;2:8-27. |
| 25. | Hoppa RD. Evaluating human skeletal growth: An Anglo-Saxon example. Int J Osteoarchaeology 1992;2:275-88. |
[Figure 1]
[Table 1], [Table 2], [Table 3]
|


 Search Pubmed for