|
 
 |
| ORIGINAL ARTICLE |
|
| Year : 2016 | Volume
: 4
| Issue : 2 | Page : 105-110 |
|
Sex differences in facial asymmetry indices among Hausa ethnic group of Nigeria
Lawan Hassan Adamu1, Samuel Adeniyi Ojo2, Barnabas Danborno3, Samuel Sunday Adebisi3, Magaji Garba Taura4
1 Department of Anatomy, Faculty of Basic Medical Sciences, Bayero University, Kano, Kano State, Nigeria
2 Department of Veterinary Anatomy, Faculty of Veterinary Medicine, Ahmadu Bello University, Zaria, Samaru Zaria, Kaduna State, Nigeria
3 Department of Human Anatomy, Faculty of Medicine, Ahmadu Bello University, Zaria, Samaru Zaria, Kaduna State, Nigeria
4 Department of Anatomy, Faculty of Basic Medical Sciences, Bayero University, Kano, Kano State, Nigeria; Department of Anatomy, College of Medicine, University of Bisha, Bisha, Saudi Arabia
| Date of Web Publication | 18-Apr-2017 |
Correspondence Address:
Lawan Hassan Adamu
Department of Anatomy, Faculty of Basic Medical Sciences, Bayero University, PMB 3011, Kano, Kano State
Nigeria
 Source of Support: None, Conflict of Interest: None  | Check |
DOI: 10.4103/aoba.aoba_32_16

Background: Evaluation of facial symmetry in a given population may help in understanding the level of environmental stress exposed by the population. Within the same population, males and females may respond differently to environmental stressors, which can be manifested as deviation from perfect symmetry. Objectives: The study seeks to investigate the sex differences in three asymmetry indices and to also determine the side dominance and type of asymmetry in facial features among Hausas of Kano state, Nigeria. Materials and Methods: A cross-sectional study carried out on Hausas of Kano state. A total of 283 individuals comprising 147 males and 136 females of age range 18–25 years were selected using simple random sampling technique. Photometric methods were used to capture the face. Three indices, signed asymmetry (SA), absolute asymmetry (AA), and composite asymmetry (CA), were used to assess asymmetry in facial dimensions. Independent sample t-test was used to test for sex differences in the variables, and one sample t-test was used to determine fluctuating asymmetry. Results: The result showed that females tend to have statistically significant mean value only in orbital width. For zygon to gnathion facial distance, the statistically significant higher mean was observed in males. For the three indices asymmetry, no significant sexual dimorphism in SA index was observed. However, males tend to have leftward SA in orbital width and zygon to gnathion distance. In AA and CA, a significant sexual dimorphism was noticed only in zygon to gnathion distance. Females had higher mean value in AA than the males; however, CA tended to be higher in male population. The facial variables exhibited fluctuating type of asymmetry. Conclusion: There are sex differences in AA and CA indices. Left warded type of SA was exhibited in male of Hausa origin. The facial asymmetry in Hausa ethnic group of Kano is more of fluctuating type of asymmetry.
Keywords: Asymmetry, facial dimensions, Hausa population, sex differences
How to cite this article:
Adamu LH, Ojo SA, Danborno B, Adebisi SS, Taura MG. Sex differences in facial asymmetry indices among Hausa ethnic group of Nigeria. Ann Bioanthropol 2016;4:105-10 |
| Introduction | |  |
Symmetry can simply be explained as the extent to which two halves of an organism is same. Ability to maintain the stable development of morphological traits varies depending on the prevailing environmental conditions under which the development is taking place.[1],[2] Perfectly bilateral face and body symmetry is largely a theoretical concept that seldom exists in living organisms.[3] Most studies of normal asymmetry have reported the existence of differences between right and left hemiface size. The dominance is usually random, leading to a concept referred to as fluctuating asymmetry (FA).[4],[5]
A character demonstrates FA when symmetry reflects the normal development, and deviations from this symmetry are randomly distributed with respect to side with a mean centered around zero.[6],[7] FA is particularly a useful measure of developmental stability, which is generally due to the fact that the optimal developmental outcome is symmetry. FA is also a useful measure as it subsumes a huge amount of individual variation in development, being the outcome of differences in genetic (e.g. inbreeding, mutation, and homozygosity) and environmental (e.g. nutrient intake, parasite load) factors.[1],[2]
The use of FA as a measure of developmental stability and variation may be an important way in the assessment of level of stress in a given population. This information is scanty in cited literature among Hausa population. Exploring sexual dimorphism in FA may be considered as the rate limiting step in determining which group between males and females is more prone to developmental stress among Hausa population. In addition, it was reported that the ability of an individual to develop successfully in the face of environmental pressures is, therefore, a proposed indicator of genetic quality.[6] We hypothesized that males are more vulnerable to environmental stress exhibited by high level of asymmetry. Therefore, the significant sex difference may be in favor of female Hausa. In this note, the present study used facial dimension to assess the sex differences in three asymmetry indices and to also determine the side dominance and existence of fluctuating type of asymmetry in both sexes of Hausa ethnic group of Kano state, Nigeria.
| Materials and Methods | | |
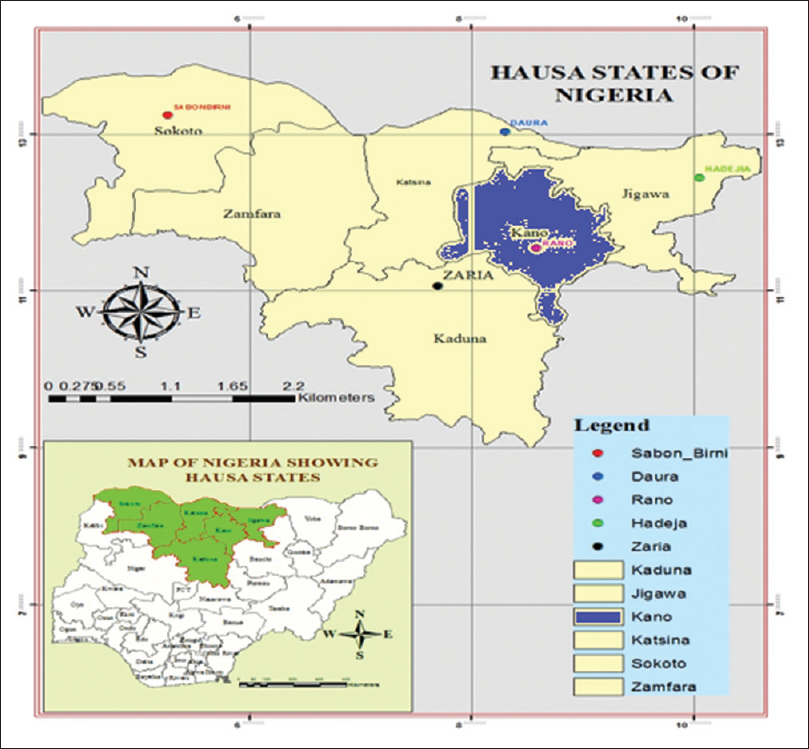
Study area and population
The study was conducted among one original Hausa state; Kano state [Figure 1] of Nigeria. Kano is the most populous state in Nigeria, with about 9,383,682 million people. The principal inhabitants of the city are the Hausa people.[8] A cross-sectional type of study was conducted. A total of 283 individuals comprising 147 males and 136 females were randomly selected. The individuals who were Hausas up to the level of grandparents, apparently healthy, whose faces were free from inflammation or deformity, were considered. Only individuals within the age range of 18–25 years were considered. This was to minimize the confounding effect of age on facial anthropometry. Ethical approval was sought from the Ethical Committee of Kano state Hospital Management Board (Kano state Research Ethical Committee) and Ahmadu Bello University, Teaching Hospital, Zaria, Faculty of Medicine (ABUTHZ/HREC/506/2015). Informed consent was obtained from the participants.
Facial photograph
To obtain the facial variables, every participant was asked to sit and look directly into a camera (Samsung ES90, 4.9–24.5 mm HD, China) in front according to the method of Moorrees,[9] keeping an upright and normal posture, with both arms free along the body. This position corresponds to the Broca's natural head position.[10] A white screen was placed behind the participant during the process to standardize the background. The camera was placed on a tripod stand (WT3570, China) to standardize the distance (100 cm) between it and the individual.[11] Before capturing the face, the protocols proposed by Reddy et al.[12] were adopted. After the images were captured, those images were uploaded to a personal computer and stored in jpeg format for processing and analyses. For measurement's error analyses, a direct facial anthropometry was adopted.[13] A digital Vernier caliper (Neiko 01407A, China) was then used to measure the facial linear dimensions. This helped in the determination of the factor to be used for real-size measurements of the photographs.
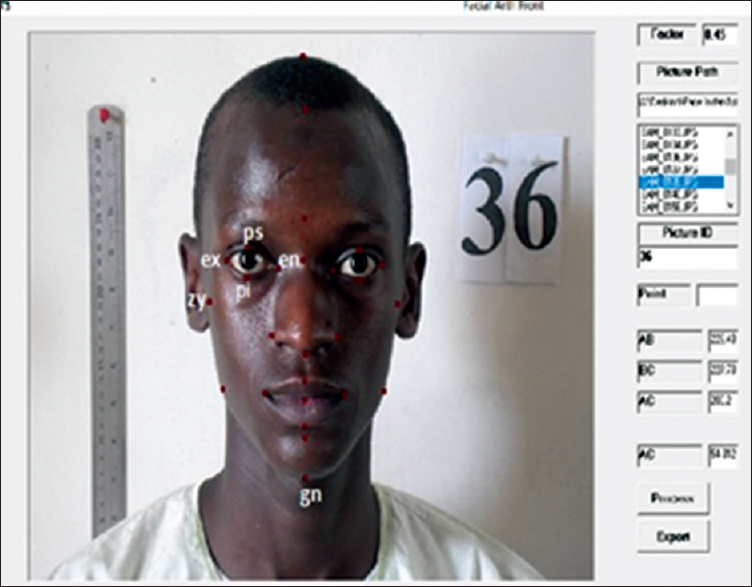
Facial landmarks and linear dimensions
Standard anatomical landmarks [13],[14],[15] were recognized [Table 1]. After correct placement of landmarks [Figure 2], the paired linear distances were measured automatically using a Bioanalyzer (a customized software using Microsoft visual basic version 6).
Measurement error
To assess the error in the variable measurement, technical error of measurement (TEM) expressed as percentage relative TEM was used.[16],[17] The strength of the measurement was determined using intraclass correlation (ICC) analysis.[18] The ICC (measure of strength of measurement) ranged from 0.89 to 0.5 and the TEM (measure of method error) was 2.79%–8.24%. These are within acceptable measurement error.[18],[19]
Asymmetry indices
Three indices of asymmetry, differences between left (L) and right (R) used, include signed asymmetry (SA), absolute asymmetry (AA), and composite asymmetry (CA). These were determined by the following formulae: SA = R − L, AA = √ (R − L)2, CA = ∑√(R − L)2/n, where n is the sample size. The existence of directional asymmetry was detected by subjecting the mean value of SA to one sample t-test.[7],[20] An asymmetry was directional if mean value of signed symmetry differs significantly from zero; otherwise, it was considered as FA.
Statistical analysis
The data were expressed as mean ± standard deviation. Independent sample t-test was used to test for sex differences in the three indices of asymmetry. SPSS version 20 statistical software (IBM Corporation, Armonk, NY, USA) was used for the statistical analysis and P < 0.05 was set as level of significance.
| Results | | |
The result showed that females tend to have higher mean value as compared to their male counterpart. However, this is statistically significant only in orbital width. For zygon to gnathion facial distance, the statistically significant higher mean value was observed in males [Table 2]. Among the three paired facial linear dimensions, orbital length showed no sexual dimorphism.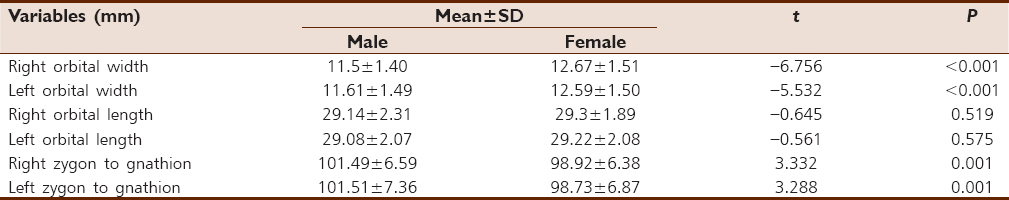 | Table 2: Descriptive statistics of the paired facial distances of male and female participants
Click here to view |
For the three indices of FA, no significant sexual dimorphism in SA index was identified; however, males tended to have leftward SA in orbital width and zygon to gnathion distance [Figure 3]. In AA, a significant sexual dimorphism was noticed only in zygon to gnathion distance [Figure 4], with females having higher mean value. Similarly, in CA, the sex differences were noticed in zygon to gnathion distance. However, in this case, males tended to have higher mean value compared to females [Figure 5].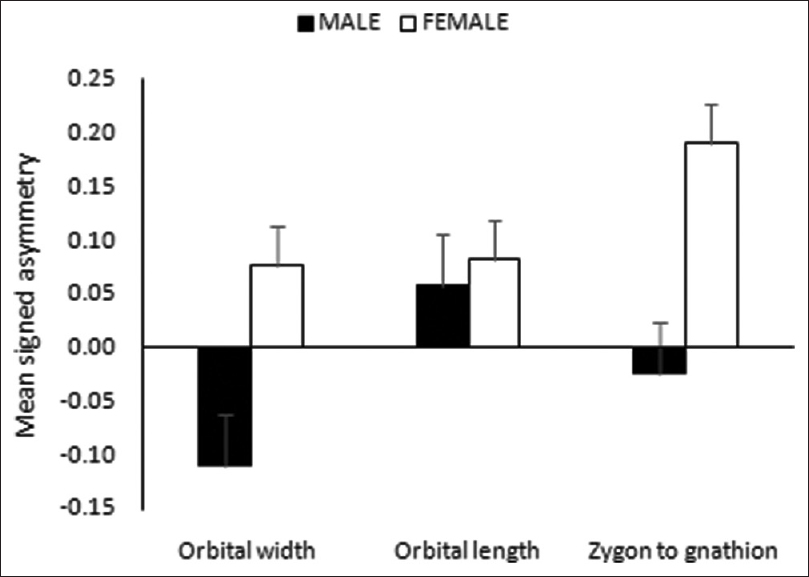 | Figure 3: Sexual dimorphism in signed asymmetry of the paired facial dimensions
Click here to view |
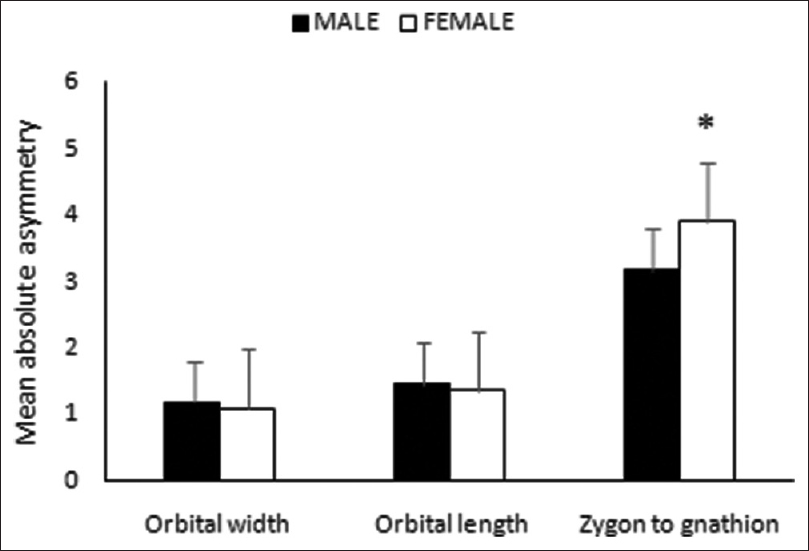 | Figure 4: Sexual dimorphism in absolute asymmetry of the paired facial dimensions (*P <0.05)
Click here to view |
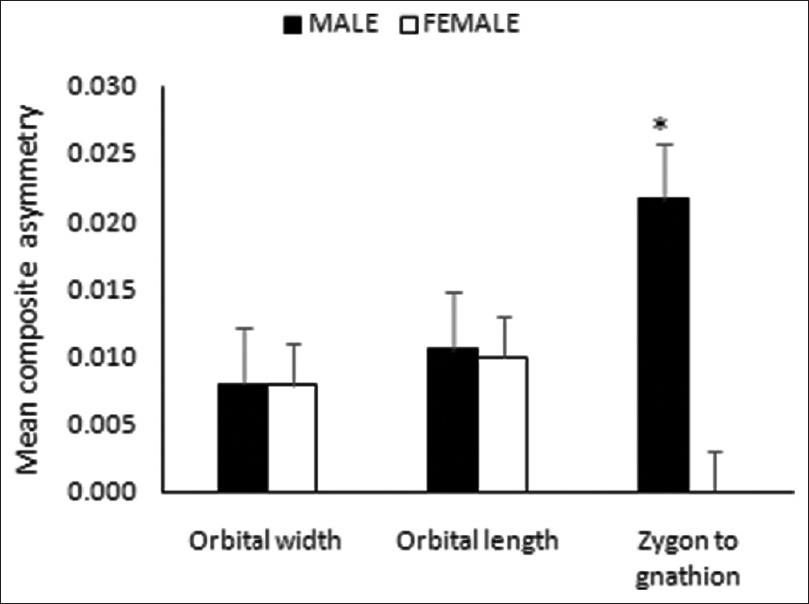 | Figure 5: Sexual dimorphism in composited asymmetry of the paired facial dimensions (*P <0.05)
Click here to view |
[Table 3] shows the assessment of FA using one sample t-test; all the facial variables are shown to exhibit FA as the mean of SA is centered on the mean of zero (mean not greater than zero).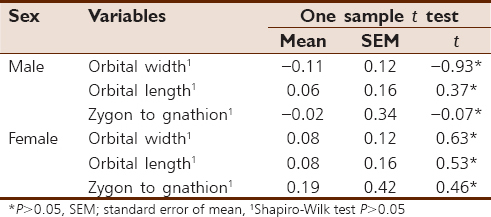 | Table 3: One sample t test and normality test for evaluation of fluctuating asymmetry of facial dimensions
Click here to view |
| Discussion | | |
Symmetry is one of the important traits thought to relate to mate-quality in many animals.[21],[22] In human faces, it has been reported to be a signal to heritable fitness benefits.[23],[24] Facial symmetry has been considered as one of the most influential visual markers of health, while asymmetry can be regarded as consequence of an individual's inability to resist environmental and genetic stressors during development.[25] The objectives of this study are to assess the sex differences in three asymmetry indices and to also determine the side dominance and existence of fluctuating type of asymmetry in both sexes of Hausa ethnic group of Kano state, Nigeria.
Sexual dimorphism pattern observed in some of facial dimensions is in line with other findings as certain facial features including eye-to-eye fissures show no sexual dimorphism.[26] In another context similar to the present study, males tended to have significantly higher mean value in most of the facial variables.[27],[28] This may support the fact that females are, in general, having smaller faces than males.[27] These also explain the idea that males have an averagely larger body size and proportion as compared to females, which is also manifesting in certain regions of the face. However, in some distances, the female had higher mean value. This may suggest that the difference in body proportions between the sexes which manifest in the facial features is not uniform across all the facial dimensions.
In this study, it was observed that in both SA and AA, females tend to have higher level of mean asymmetry indices compared to male, with significant difference observed in AA. Using composite index CA, male tended to have higher asymmetry indices as compared to female. It was reported that composite indices of asymmetry, combining data from more than one independent trait, are considerably more powerful than indices based on single traits.[29] It was also reported that the simplest composite index involves computing a standardized, summed asymmetry value for each individual.[29] Hence, in the interpretation of level of asymmetry for this population, we considered the composite index. When examining facial FA only, it was reported that the asymmetry in male faces was higher than those in female faces. It was seen that although females are predicted to have a higher buffering capacity than males, there is little evidence to support a higher level of developmental stability in females than males.[30] It was also reported that in both Kung San and Kavango population of Northern Namibia, males have higher FA compared to their female counterparts.[31]
It was suggested that environmental stress, such as poor living conditions, may affect males more strongly than females because, in many species including humans, males tend to be more vulnerable compared to females.[32] High-quality males and females can maintain low level of asymmetric facial development under environmental and genetic stress. Males and females have often been shown to react differently to the same environment, but how much of that difference is attributable to environmental versus biological factors is a matter of debate.[33] A number of studies involving measures of heath and developmental stability other than asymmetry have discussed the presumed increased buffering in females relative to males.[33],[34] This may indicate that males are prone to effect of environmental stress compared to female. One of the reasons may be higher level of exposure to environmental stressors among males. This is in line with the fact that the tendency of an organism to be asymmetrical may be linked to the increase in the environmental stresses.[2] Numerous studies have demonstrated that individuals who are better able to resist developmental stress express higher levels of symmetry than others.[1],[2],[6],[35] In humans, it is known that individuals in poor living conditions suffer from malnutrition and have limited access to health services, which make them more prone to infectious diseases,[36],[37] and this may be particularly true for males.[33],[38]
Using one sample t-test as a criterion of differentiating fluctuating and directional type of asymmetry, all the facial variables exhibit FA in both males and females. FA which was considered as small random deviations (around a mean of zero) from perfect bilateral symmetry may not be fully observed in some bilateral traits. Criterion was put in place to assess the possibility of a bilateral trait to exhibit FA.[7],[20],[32] In the previous studies, it was reported that 12 of 35 traits (34%) in male faces had the statistical properties characteristic of FA. The remaining 66% of traits exhibited directional asymmetry. For female faces, seven of 35 traits (20%) had the statistical properties of FA. The remaining traits exhibit directional asymmetry.[30] This may show that some of the facial traits exhibited directional type of asymmetry while others exhibit FA type of asymmetry. The present finding supports the existence of facial FA. It should be noted that only one criterion of assessment of FA was used in this study. The repeatability of the FA was not assessed; however, the measured variable is within the acceptable measurement error.
Most studies suggest that the left side of the face is more expressive of emotions. Such a functional asymmetry in facial expression may have some relationship to the dimensional balance between the left and the right hemiface. Most researchers have concluded that environmental influences were the most likely causes.[33],[34] Habitual chewing on one side has been reported to lead to increased skeletal development on the ipsilateral side.[39] Others have also discussed the possibility that such laterality is simply a response of functional adaptation to asymmetrical masticatory activity.[40] It can be speculated that the laterality in normal asymmetry consistently found in human faces may likely be induced by prenatal rather than postnatal factors, such as a functional bias induced by facedness or lateral preference in mastication.[41] There is need to identify the potential environmental stressors that specifically affect population. Roles of other independent factors such as living condition, socioeconomic status, and domicile among others in expression of asymmetry in this population need to determine in the future study.
| Conclusion | | |
The existence of sexual dimorphism in AA and CA facial asymmetry indices was established among Hausa population of Kano state. Males were observed to have leftward asymmetry orbital width and zygon to gnathion distance. The existence of fluctuating type of asymmetry using one sample t-test was also established in this population.
Declaration of patient consent
The authors certify that they have obtained all appropriate patient consent forms. In the form the patient(s) has/have given his/her/their consent for his/her/their images and other clinical information to be reported in the journal. The patients understand that their names and initials will not be published and due efforts will be made to conceal their identity, but anonymity cannot be guaranteed.
Acknowledgment
We thank all those who volunteered to participate in this research and also Sunusi Aminu who helped in the development of the software used as well as other technical assistance.
Financial support and sponsorship
The work is component of PhD dissertation which was sponsored by Bayero University Research Grant Unit and Tertiary Education Trust (TETFund) of Nigeria.
Conflicts of interest
There are no conflicts of interest.
| References | | |
| 1. | Møller AP. Developmental stability and fitness: A review. Am Nat 1997;149:916-32.  |
| 2. | Møller AP, Swaddle JP. Asymmetry, Developmental Stability, and Evolution. Oxford, UK: Oxford University Press; 1997. p. 1-36. |
| 3. | Cheong YW, Lo LJ. Facial asymmetry: Etiology, evaluation, and management. Chang Gung Med J 2011;34:341-51. |
| 4. | Peck S, Peck L, Kataja M. Skeletal asymmetry in esthetically pleasing faces. Angle Orthod 1991;61:43-8. |
| 5. | Ferrario VF, Sforza C, Miani A Jr., Serrao G. A three-dimensional evaluation of human facial asymmetry. J Anat 1995;186(Pt 1):103-10. |
| 6. | Valen LV. A study of fluctuating asymmetry. Evolution 1962;16:125-42. |
| 7. | Palmer AR, Strobeck C. Fluctuating asymmetry analysis revisited. In: Polak M, editor. Developmental Instability; Causes and Consequences. New York: Oxford University Press; 2003. p. 279-319. |
| 8. | Barau AS. The Great Attractions of Kano. Research and Documentation Publications. Research and Documentation Directorate, Government House Kano; 2007. |
| 9. | Moorrees CF. Natural head position – a revival. Am J Orthod Dentofacial Orthop 1994;105:512-3. |
| 10. | Ferrario VF, Sforza C, Miani A, Tartaglia G. Craniofacial morphometry by photographic evaluations. Am J Orthod Dentofacial Orthop 1993;103:327-37. |
| 11. | Morosini IA, Peron AP, Correia KR, Moresca R. Study of face pleasantness using facial analysis in standardized frontal photographs. Dent Press J Orthod 2012;17:24-3. |
| 12. | Reddy M, Aliyu NK, Raghav P, Kundu V, Mishra V. A computer assisted angular photogrammetric analysis of the soft time facial profile of North Indian adults. J Indian Orthod Soc 2012;45:119-23. |
| 13. | Farkas LG. Examination. In: Farkas LG, editor. Anthropometry of the Head and Face. 2 nd ed. New York: Raven Press; 1994. p. 3-56. |
| 14. | Porter JP, Olson KL. Anthropometric facial analysis of the African American woman. Arch Facial Plast Surg 2001;3:191-7. |
| 15. | Gibelli D, Mapelli A, Obertovà Z, Poppa P, Gabriel P, Ratnayake M, et al. Age changes of facial measurements in European young adult males: Implications for the identification of the living. Homo 2012;63:451-8. |
| 16. | Aldridge K, Boyadjiev SA, Capone GT, DeLeon VB, Richtsmeier JT. Precision and error of three-dimensional phenotypic measures acquired from 3dMD photogrammetric images. Am J Med Genet A 2005;138A:247-53. |
| 17. | Perini TA, Oliveira1 GL, Ornellas JS, de Oliveira FP. Technical error of measurement in anthropometry. Rev Bras Med Sport 2005;11:86-90. |
| 18. | Shrout PE, Fleiss JL. Intraclass correlations: Uses in assessing rater reliability. Psychol Bull 1979;86:420-8. |
| 19. | Weinberg SM, Scott NM, Neiswanger K, Brandon CA, Marazita ML. Digital three-dimensional photogrammetry: Evaluation of anthropometric precision and accuracy using a Genex3D camera system. Cleft Palate Craniofac J 2004;41:507-18. |
| 20. | Manning JT. Fluctuating asymmetry and body weight in men and women: Implications for sexual selection. Ethol Sociobiol 1995;16: 145-53. |
| 21. | Hume DK, Montgomerie R. Facial attractiveness signals different aspects of “quality” in women and men. Evol Hum Behav 2001;22:93-112. |
| 22. | Hö nekopp J, Bartholomé T, Jansen G. Facial attractiveness, symmetry, and physical fitness in young women. Hum Nat 2004;15:147-67. |
| 23. | Klingenberg CP, Wetherill L, Rogers J, Moore E, Ward R, Autti-Rämö I, et al. Prenatal alcohol exposure alters the patterns of facial asymmetry. Alcohol 2010;44:649-57. |
| 24. | Boyd A, Golding J, Macleod J, Lawlor DA, Fraser A, Henderson J, et al. Cohort profile: The 'children of the 90s' – the index offspring of the avon longitudinal study of parents and children. Int J Epidemiol 2013;42:111-27. |
| 25. | Š vegar D, What does facial symmetry reveal about health and personality? Polish Psychol Bull 2016;47:356-65. |
| 26. | Karaca O, Gülcen B, Kuş MA, Elmal F, Kuş I. Morphometric facial analysis of Turkish adults. Balikesir Saglik Bil Derg Skin 2011;1:7-11. |
| 27. | Zhuang Z, Guan J, Hsaio H, Bradtmiller B. Evaluating the representativeness of the LANL respirator fit test panels for the current U.S. civilian workers. J Int Soc Respir Prot 2004;21:83-93. |
| 28. | Sforza C, Grandi G, Binelli M, Dolci C, De Menezes M, Ferrario VF. Age- and sex-related changes in three-dimensional lip morphology. Forensic Sci Int 2010;200:182.e1-7. |
| 29. | Leung B, Forbes MR, Houle D. Fluctuating asymmetry as a bioindicator of stress: Comparing efficacy of analyses involving multiple traits. Am Nat 2000;155:101-15. |
| 30. | Simmons LW, Rhodes G, Peters M, Koehler N. Are human preferences for facial symmetry focused on signal of developmental instability? Behav Ecol 2004;15:864-71. |
| 31. | Kirchengast S. Directional and fluctuating asymmetry among! Kung San and Kavango people of Northern Namibia: The impact of sex and subsistence patterns. Am J Hum Biol 2016;00:00.1-10 [Doi: 10.1002/ajhb.22921]. |
| 32. | Ozener B. Brief communication: Facial fluctuating asymmetry as a marker of sex differences of the response to phenotypic stresses. Am J Phys Anthropol 2010;143:321-4. |
| 33. | Møller AP, Fincher CL, Thornhill R. Why men have shorter lives than women: Effects of resource availability, infectious disease, and senescence. Am J Hum Biol 2009;21:357-64. |
| 34. | Thornhill R, Møller AP. Developmental stability, disease, and medicine. Biol Rev Camb Philos Soc 1997;72:497-548. |
| 35. | Klein SL. Hormonal and immunological mechanisms mediating sex differences in parasite infection. Parasite Immunol 2004;26:247-64. |
| 36. | Adler NE, Boyce T, Chesney MA, Cohen S, Folkman S, Kahn RL, et al. Socioeconomic status and health. The challenge of the gradient. Am Psychol 1994;49:15-24. |
| 37. | Chen E, Matthews KA, Boyce WT. Socioeconomic differences in children's health: How and why do these relationships change with age? Psychol Bull 2002;128:295-329. |
| 38. | Kraemer S. The fragile male. BMJ 2000;321:1609-12. |
| 39. | Shah SM, Joshi MR. An assessment of asymmetry in the normal craniofacial complex. Angle Orthod 1978;48:141-8. |
| 40. | Vig PS, Hewitt AB. Asymmetry of the human facial skeleton. Angle Orthod 1975;45:125-9. |
| 41. | Haraguchi S, Iguchi Y, Takada K. Asymmetry of the face in orthodontic patients. Angle Orthod 2008;78:421-6. |
[Figure 1], [Figure 2], [Figure 3], [Figure 4], [Figure 5]
[Table 1], [Table 2], [Table 3]
|


 Search Pubmed for