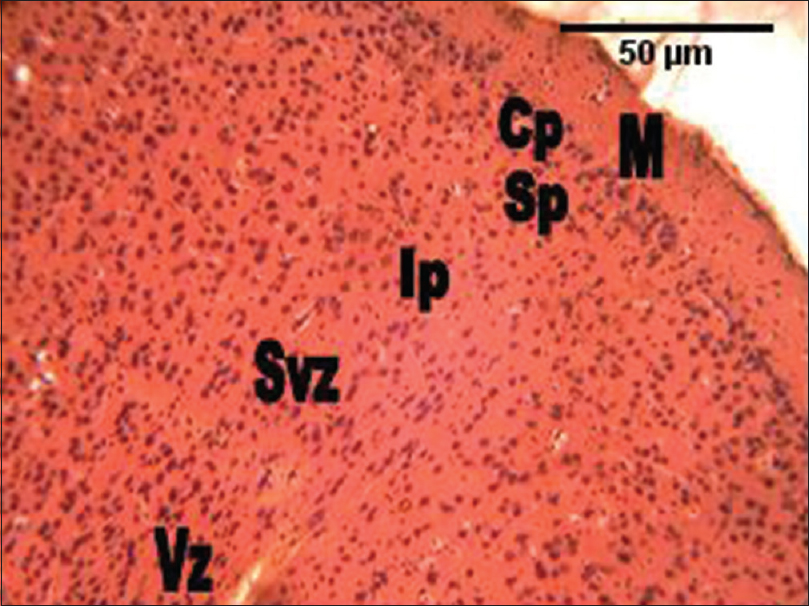
Figure 2: The photomicrograph of the cerebral cortex of the control group showing the marginal zone containing mostly processes, with sparse cell density. The cortical plate shows much cell density. The subcortical plate has less cellular density. The intermediate, subventricular and the ventricular zones are not distinguishable, with the layers showing numerous cellular densities. M = Marginal zone; Cp = Cortical plate; Sp = Subcortical plate; Ip = Intermediate; Svz = Sub-ventricular; and the Vz = Ventricular zones (H and E, ×100)