Close
  Indian J Med Microbiol
 

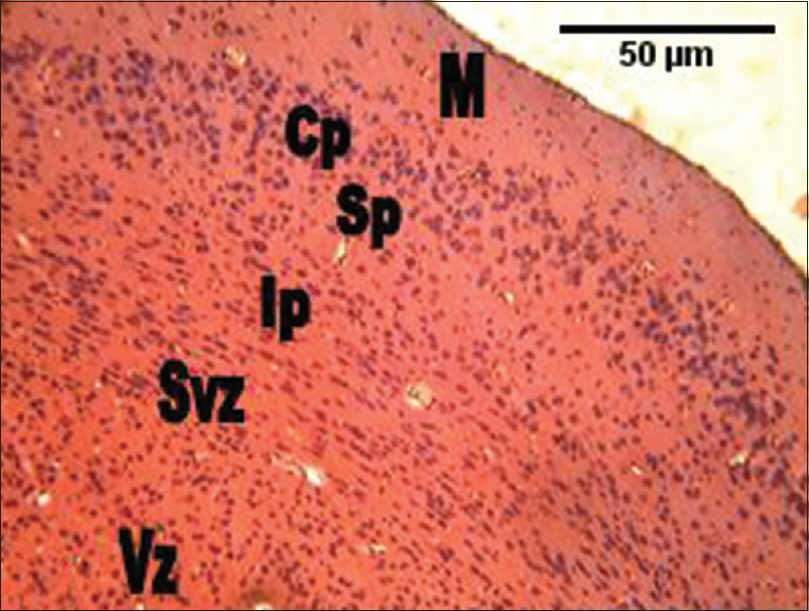
Figure 5: The photomicrograph of the cerebral cortex of the group administered the combination of Rauvolfia vomitoria and Gongronema latifolium (Rauvolfia vomitoria+ Gongronema latifolium) showing much cellular density, but smaller cellular sizes in the intermediate zones through to the ventricular zones. However, the cortical cells were slightly larger compared with the control group. M = Marginal zone; Cp = Cortical plate; Sp = Subcortical plate; Ip = Intermediate; Svz = Sub-ventricular; and the Vz = Ventricular zones (H and E, ×100)

Figure 5: The photomicrograph of the cerebral cortex of the group administered the combination of <i>Rauvolfia vomitoria</i> and <i>Gongronema latifolium</i> (<i>Rauvolfia vomitoria</i>+ <i>Gongronema latifolium</i>) showing much cellular density, but smaller cellular sizes in the intermediate zones through to the ventricular zones. However, the cortical cells were slightly larger compared with the control group. M = Marginal zone; Cp = Cortical plate; Sp = Subcortical plate; Ip = Intermediate; Svz = Sub-ventricular; and the Vz = Ventricular zones (H and E, ×100)