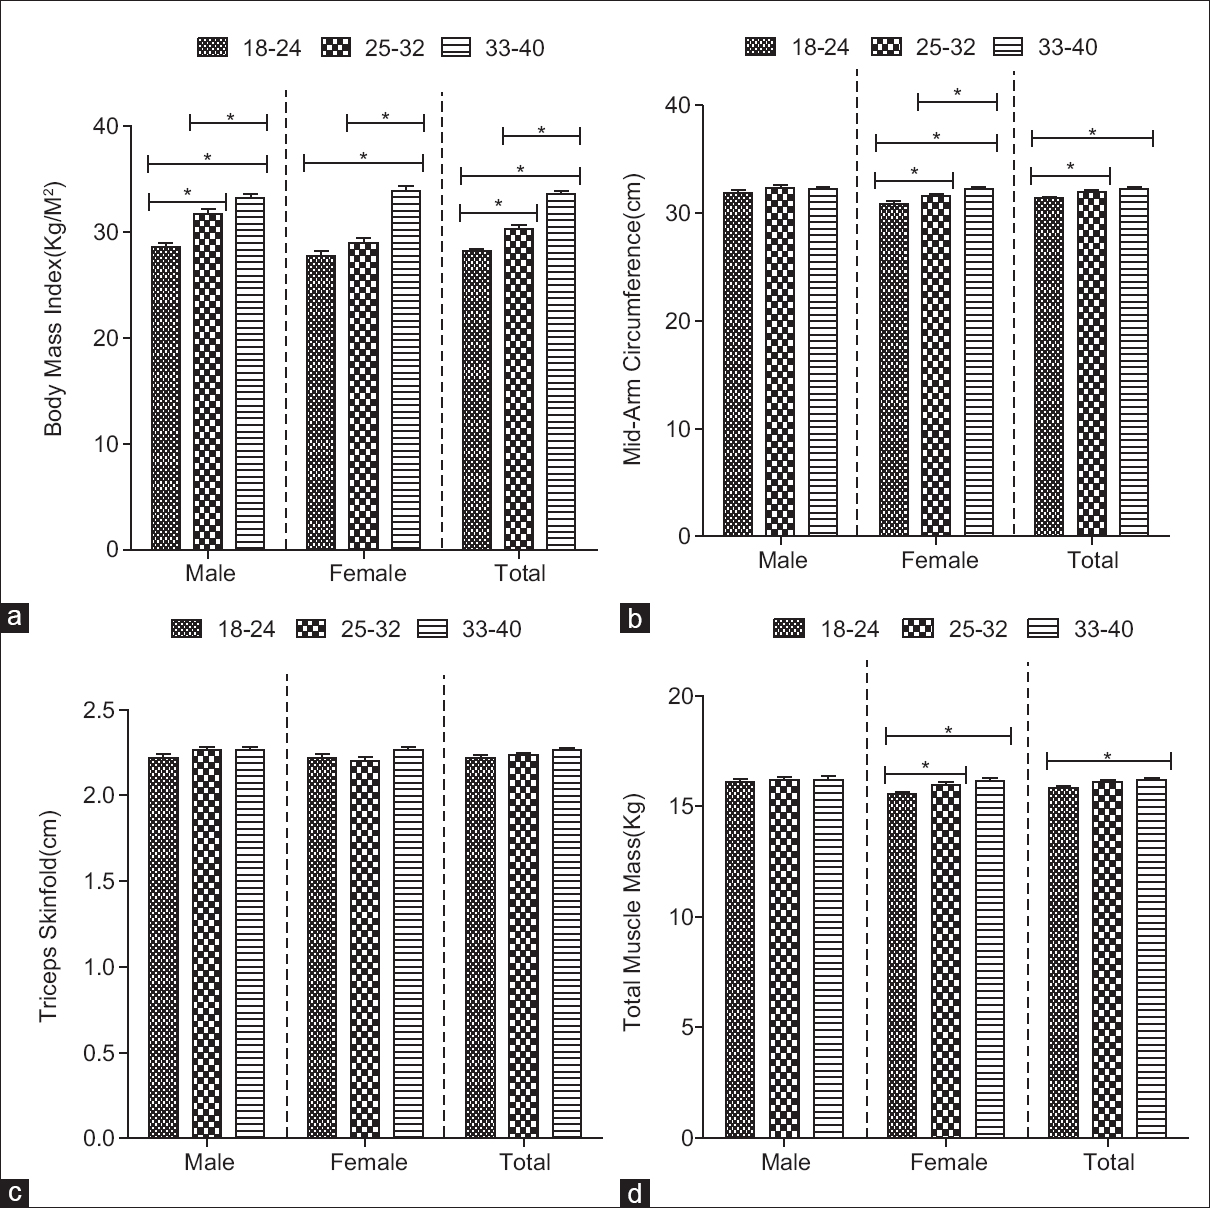
Figure 5: Comparing body mass index (a), mid-arm circumference (b), triceps skinfolds (c), and total muscle mass (d) across age groups of Igbo for males, females, and irrespective of gender. Bars are mean ± standard error of the mean. * denotes significant difference at P < 0.05. One-way ANOVA followed by Newman–Keuls tests for multiple comparisons