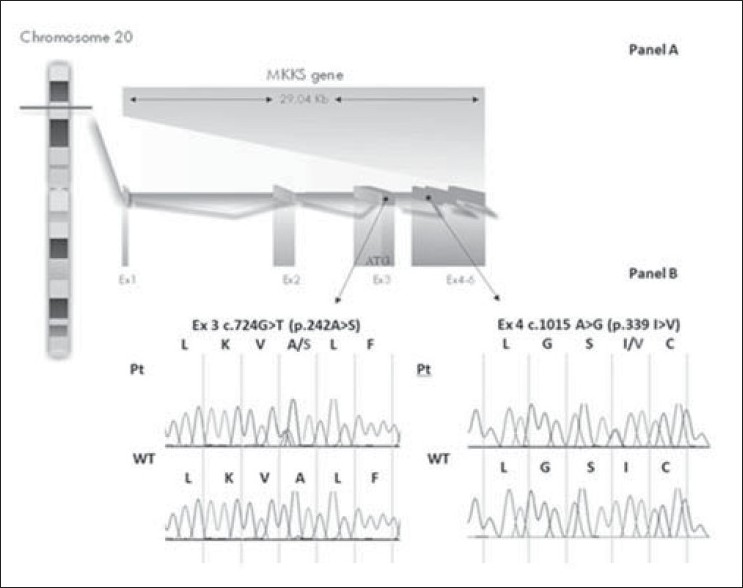
Figure 3: A schematic representation of the MKKS gene locus and mutations identifi ed (Panel A) and chromatographs (Panel B) showing the sequence variation p.242A>S in exon 3 (left) and the sequence variation p.339I>V in exon 4 (right) in the proband (Pt) and a control subject (WT).