
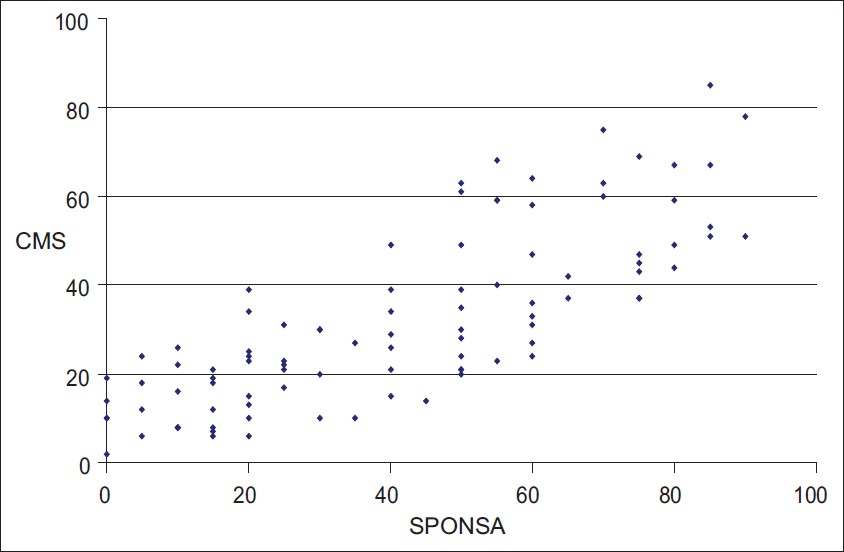
Figure 4: Correlation of SPONSA with Constant Score. Combined pre- and post-treatment. Pearson correlation coefficient=0.78 (n=95). A graphical representation of the correlation between the SPONSA and the Constant Score
|
|
Close |
|
Figure 4: Correlation of SPONSA with Constant Score. Combined pre- and post-treatment. Pearson correlation coefficient=0.78 (n=95). A graphical representation of the correlation between the SPONSA and the Constant Score
|
|