|
 
 |
| ORIGINAL ARTICLE |
|
| Year : 2015 | Volume
: 3
| Issue : 2 | Page : 119-123 |
|
An evaluation of tooth size discrepancies among different malocclusion groups in North Indians
Vinay Kumar Chugh1, Pradeep Tandon2, Vijay Prakash Sharma3, Amit Nagar2, Rana Pratap Maurya4, Ankita Chugh5
1 Department of Orthodontics and Dentofacial Orthopedics, Vyas Dental College and Hospital, Rajasthan, India
2 Department of Orthodontics and Dentofacial Orthopedics, Faculty of Dental Sciences, KG Medical University, Lucknow, Uttar Pradesh, India
3 Department of Orthodontics and Dentofacial Orthopedics, Chandra Dental College, Barabanki, Uttar Pradesh, India
4 Department of Orthodontics and Dentofacial Orthopedics, BBD University, Lucknow, Uttar Pradesh, India
5 Department of Dentistry, All India Institute of Medical Sciences, Jodhpur, Rajasthan, India
| Date of Web Publication | 15-May-2015 |
Correspondence Address:
Vinay Kumar Chugh
Department of Orthodontics, Vyas Dental College and Hospital, Pali Road, Kudi Haud, Jodhpur - 342 005, Rajasthan
India
 Source of Support: None, Conflict of Interest: None  | Check |
DOI: 10.4103/2321-3825.150569

Objective: A study was conducted to evaluate tooth size discrepancies among different malocclusion groups. Materials and Methods: This study consisted of 160 North Indian subjects, 50 normal occlusion group and 110 subjects with varying degree of malocclusion, that is, Angle's Class I (40), Class II Division 1 (40) and Class III (30) malocclusion, respectively. Tooth size measurements were performed on the study models by using a digital Caliper with a liquid crystal display digital output to the nearest 0.01 mm, and various inter-arch ratios were analyzed. Statistical Analysis: One-way analysis of variance was used to analyze the difference in groups followed by Tukey post hoc test. Chi-square test was performed to demonstrate the prevalence of tooth size discrepancies among three malocclusion groups. Results: Significant differences were found for inter-arch ratios between the groups. Conclusions: Anterior, overall, and posterior ratios were higher in Class III followed by Class I and Class II Division 1 malocclusion, respectively. Anterior and overall tooth size discrepancy was found to be 20% and 17.2%, respectively, in the malocclusion sample. Keywords: Inter-arch ratios, malocclusion, tooth size discrepancy
How to cite this article:
Chugh VK, Tandon P, Sharma VP, Nagar A, Maurya RP, Chugh A. An evaluation of tooth size discrepancies among different malocclusion groups in North Indians. J Orthod Res 2015;3:119-23 |
How to cite this URL:
Chugh VK, Tandon P, Sharma VP, Nagar A, Maurya RP, Chugh A. An evaluation of tooth size discrepancies among different malocclusion groups in North Indians. J Orthod Res [serial online] 2015 [cited 2018 Sep 6];3:119-23. Available from: http://www.jorthodr.org/text.asp?2015/3/2/119/150569 |
| Introduction | |  |
Tooth size discrepancies are considered to be an important variable especially in the anterior segment. an excellent orthodontic treatment result with the optimum occlusion and ideal intercuspation, overjet, and overbite is often jeopardized by tooth size discrepancies or altered tooth anatomy. A high percentage of the finishing phase difficulties arise because of tooth size imbalances that should have been detected and considered during initial diagnosis and treatment planning.
Earlier methods used by orthodontists to detect inter-arch tooth size discrepancies in patient presenting for orthodontic treatment were Kesling's [1] diagnostic set-up, Lundstrom's [2] intermaxillary indices and Neff's [3] anterior coefficient. These studies were followed by the classic work of Bolton [4],[5] who quantified the maxillary to mandibular tooth size relationship and provided the accepted normative data.
Tooth size difference exists among various malocclusions groups as stated by Lavelle [6] that teeth in the lower arch are larger in Class III than Class II and Class I malocclusion. [7] Crosby and Alexander [8] stated that a tooth size discrepancy has to be >+2 standard deviation (SD) to influence the course of orthodontic treatment. Nie and Lin [9] found significant differences in the Bolton ratio among several occlusal categories.
Previous studies on Indian population [10],[11] have evaluated Bolton anterior ratio (AR) and overall ratio (OR) in normal occlusion but no attempt was made by the authors to evaluate tooth size ratios in different malocclusion groups. As North Indian population constitute the majority of the orthodontic patients in many dental care institutions in metropolitan areas, the scarcity of applicable data in this population needs to be addressed. No published data establish tooth size ratios among different malocclusions for diagnosis and treatment planning of North Indian patients. With these points in mind, an attempt is made in this study to investigate the relationship between tooth size discrepancies and different malocclusion groups.
The Objectives of the Present Study Were
- To evaluate tooth size discrepancies among different malocclusion groups.
- To determine the prevalence of tooth size discrepancy among different malocclusion groups.
| Materials and Methods | | |
A total of 160 pairs of orthodontic study casts was included in this study. Data for the study were obtained from the records of the Department of Orthodontics and Dentofacial Orthopedics, Faculty of Dental Sciences, CSM Medical University, Lucknow, Uttar Pradesh, India.
The criteria for sample selection were as follows:
- North Indian subjects.
- Patient age ranged from 13 to 25 years.
- Good quality dental study casts.
- Presence of all permanent teeth from central incisors to second molars in all four quadrants completely erupted.
- Exclusion of study casts with tooth deformities, mesiodistal restorations or abrasion/attrition.
- No history of previous orthodontic treatment.
The sample was selected according to Angle's [12] classification and contained the following:
- Fifty pairs of Class I normal occlusion designated as the normal occlusion group (criteria used was good occlusion with well-balanced faces; Class I occlusion with well aligned upper and lower dental arches; minor or no crowding).
- Forty pairs of Class I malocclusion (Full Cusp bilateral Class I molar relation).
- Forty pairs of Class II Division 1 malocclusion (Full Cusp bilateral Class II molar relation) and.
- Thirty pairs of Class III malocclusion (Full Cusp bilateral Class III molar relation) were combined and designated as a malocclusion group.
- Subdivision cases and cusp to cusp relation cases were not included in the study.
Dental Study Cast Measurements
On the dental cast of each patient, each tooth from the maxillary and mandibular right first molar to the left first molar was measured at the largest mesiodistal dimension as suggested by Moorrees et al. [13] to the nearest 0.01 mm, using a digital Caliper with a liquid crystal display digital output [Table 1]. An analysis of error was performed by remeasuring 20 dental cast selected randomly using paired t-test. All the measurements were repeated after 2 weeks by the same investigator. No statistically significant differences were found (P > 0.05) when the repeat measurements were evaluated. 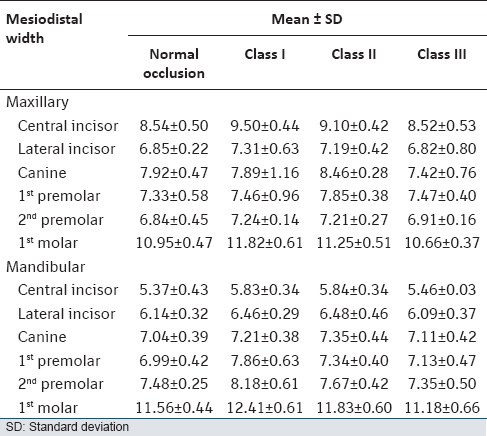 | Table 1: Mean and SD of mesiodistal width of each tooth in normal occlusion and malocclusion groups
Click here to view |
Three inter-arch ratios were then analyzed.
- Bolton's AR: AR is established by dividing mandibular six anterior teeth (left canine to right canine) by maxillary six anterior teeth (left canine to right canine).
- Bolton's OR: OR can be calculated by dividing the sum of mandibular twelve teeth (left first molar to right first molar) by sum of maxillary twelve teeth (left first molar to right first molar).
- Smith et al. [14] posterior ratio (PR): PR can be calculated by dividing the sum of mandibular six posterior teeth (left first premolar to left first molar and right first premolar to right first molar) by sum of maxillary twelve teeth (left first premolar to left first molar and right first premolar to right first molar).
Statistical Analysis
SPSS Version 10 (SPSS Inc., Chicago, IL, USA) software was used for statistical analysis. Descriptive statistics including mean and SD were calculated for various inter-arch ratios among different groups. Group differences were analyzed with analysis of variance (ANOVA). For multiple comparisons, a post hoc Tukey honestly significant difference (HSD) test was performed. Chi-square test was performed to statistically compare the prevalence of tooth size discrepancies among three malocclusion groups.
| Results | | |
Descriptive statistics for mesiodistal width of the teeth and tooth size ratios in each group is summarized in [Table 1] and [Table 2]. According to ANOVA, inter-arch ratios showed statistically significant differences among the occlusal groups. Significant differences among groups were observed in ARs (P < 0.05), ORs (P < 0.05) and PRs (P < 0.01) [Table 2]. Multiple comparisons of the normal and malocclusion groups via Tukey HSD showed that all the inter-arch ratios were found to be higher in Class III group of which AR (P < 0.05) and OR (P < 0.001) were significantly higher. The mean values for OR (P < 0.05) and PR (P < 0.01) in normal occlusion group were significantly higher when compared with Class I group and Class II group, respectively [Table 3]. Multiple comparisons of the malocclusion groups via Tukey HSD showed that all the inter-arch ratios were increased in Class III when compared to Class II of which OR (P < 0.001), AR (P < 0.01) and PR (P < 0.01) were significantly higher. The mean values for OR (P < 0.01) and PR (P < 0.05) in Class I group was significantly higher when compared with Class II Division 1 group [Table 4].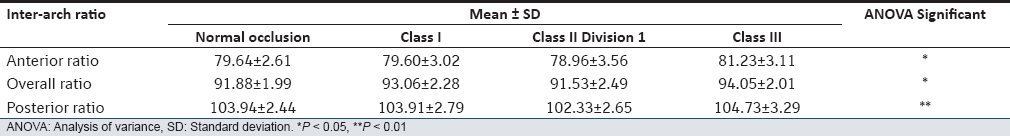 | Table 2: Descriptive statistics and statistical comparisons (ANOVA) of anterior, overall, and posterior ratios among normal and different malocclusion groups
Click here to view |
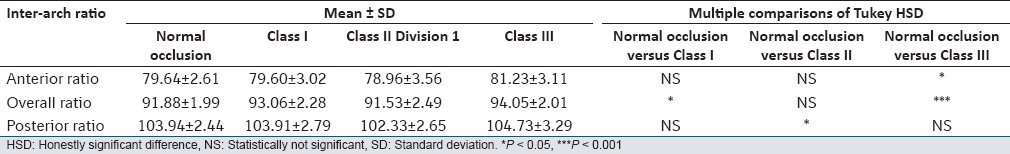 | Table 3: Statistical comparisons of anterior, overall, and posterior ratios among normal and different malocclusion groups via post hoc Tukey HSD test
Click here to view |
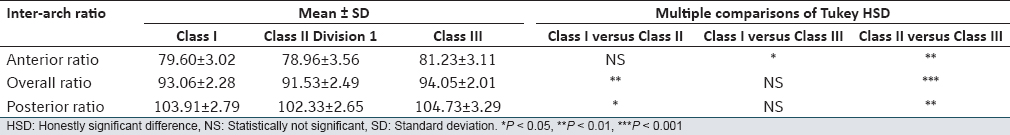 | Table 4: Statistical comparisons of anterior, overall, and posterior ratios among different malocclusion groups via post hoc Tukey HSD test
Click here to view |
"Chi-square" test demonstrated percentage of patients with clinically significant anterior tooth size discrepancy (+2 SD) was 20% in Class I, 17.5% in Class II Division 1 and 23.3% in Class III malocclusion, respectively. Percentage of patients with clinically significant anterior tooth size discrepancy (+2 SD) was found to be 20% in the total malocclusion sample [Table 5]. Clinically significant anterior tooth size discrepancy (+2 SD) was found to be higher in Class III followed by Class I and then by Class II Division 1 malocclusion, although the differences were not statistically significant.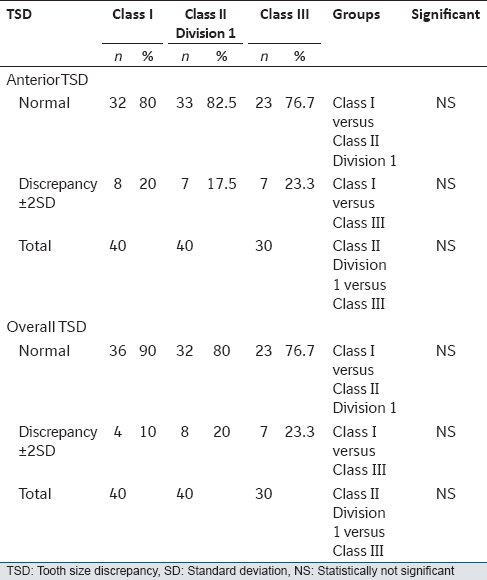 | Table 5: Chi-square test to demonstrate the prevalence of ±2SD Bolton anterior and overall TSD among different malocclusion groups
Click here to view |
Percentage of patients with clinically significant overall tooth size discrepancy (+2 SD) was 10% in Class I, 20% in Class II Division 1 and 23.3% in Class III malocclusion, respectively. Percentage of patients with clinically significant overall tooth size discrepancy (+2 SD) was found to be 17.2% in the total malocclusion sample. Clinically significant overall tooth size discrepancy (+2 SD) was found to be similar in Class III and Class I followed by Class II Division 1 malocclusion, although the differences were not statistically significant [Table 5].
| Discussion | | |
In the present study, prevalence and comparison of tooth size discrepancy in a different malocclusion group was studied. To eliminate the influence of attrition or restoration on mesiodistal width, younger age group subjects were selected for the current study. As previous studies [9],[15],[16],[17] has confirmed that significant differences for inter-arch ratios between males and females do not exist, therefore sample was not divided on the basis of sex. Though the mesiodistal width of individual tooth shows some variations in males and females but when they are computed as ratios the results tend to be nonsignificant.
On the comparison between normal occlusion and malocclusion groups, Bolton's [4] AR, OR were significantly higher in Class III malocclusion. Nie and Lin [9] also showed that Class III cases are characterized by smaller maxillary tooth dimensions and larger mandibular teeth. Uysal et al. [18] found significant differences in Class III malocclusion for the OR, but not for the AR when compared to normal occlusion. No statistically significant differences were found when AR was compared in normal occlusion and Class I and Class II malocclusion groups. However, OR was significantly higher in Class I as compared to normal occlusion group. This could be explained by a relatively larger mandibular arch segment or smaller maxillary arch segment than normal occlusion. PR was significantly higher in normal occlusion group when compared to Class II group. Smith et al. [14] in their study on Black, Hispanics, and White found that PR, demonstrated the greatest population difference as compared to other ratios.
In the malocclusion groups, on comparison of Inter-arch ratios of Class I and Class II, ORs and PRs were significantly higher in Class I group. It was found that ARs, ORs, and PRs were significantly higher in Class III group when compared with Class II group. Araujo and Souki [15] found similar results, that is, frequency, as well as the magnitude of anterior tooth size discrepancy, was greater in Class III and Class I followed by Class II Division 1 malocclusion. The finding of the present study are also consistent with work of Nie and Lin, [9] who showed that tendency for AR, PR and OR was found to be greater in Class III and Class I, than Class II Division 1 malocclusion. Sperry et al. [19] showed that Class III group with mandibular prognathism had more patients with mandibular tooth size excess. Result of the present study that Class III patients present greater tooth size discrepancy is important to clinician who is concerned with accurate diagnosis and treatment planning. On the basis of foregoing, it is clear that Class III malocclusion exhibited significant differences for ARs and ORs when compared to normal occlusion.
Frequency of Tooth Size Discrepancy
The frequency of tooth size discrepancy outside 2 SD was used as an index of the clinical significance of tooth size imbalances in our sample. However, the mean value for AR and OR derived from normal occlusion group of the North Indian population was used instead of Bolton's mean value. It was determined that 20% of patient (22 individual out of 110 in the total malocclusion group) had anterior tooth size discrepancy outside 2 SD. The findings of the present study are coincident with those presented by Crosby and Alexander [8] (22.9%) and were close to findings of Freeman et al. [20] (30%) and Santoro et al. [21] (28%). However, they used Bolton's [4] mean value, while in present sample mean derived from normal occlusion group was used, as mean value given by Bolton will not be applicable to the present population due to racial differences. Overall tooth size discrepancy was found to be present in (17.2%) of the sample and which is on the higher side as compared to finding of Santoro et al[21] (11%) when compared between malocclusion groups.
Frequency of tooth size discrepancy (Bolton's [4] anterior and overall) was the highest for Class-III malocclusion. Ta et al. [22] in their study on Chinese population reported tooth size discrepancy to be more frequent in the anterior region, especially in Class III malocclusion. These results are consistent with findings of Araujo and Souki [15] and also with Uysal et al. [18] (15.35%) although, the differences were not statistically significant among different malocclusion groups. However, when the normal sample was compared with malocclusion sample results were found to be statistically significant. Hence, it is clear from the above discussion that the significant number of persons are affected by tooth size discrepancies, and hence this should be taken into consideration during diagnosis and treatment planning.
The other factors that influence ideal tooth-size relationship are inter-incisal angle, tip, torque, [23] and tooth thickness [24] as speculated or indicated by many authors. Hence, it would seem prudent for clinicians to routinely include a tooth size analysis in their initial case assessment. This would allow a more efficient diagnosis of problems, more specificity in treatment planning and a higher success rate in optimum occlusions, overjet, and overbite.
| Conclusion | | |
Mesiodistal tooth size was measured, and ratios were analyzed and compared among different malocclusion groups and normal occlusion in North Indian population. On the basis of the results of this investigation, the following conclusions were drawn:
- Anterior, overall, and posterior tooth size discrepancy for Angle's Class III subjects was significantly higher, followed by Class I and Class II Division 1 subjects.
- Clinically significant anterior tooth size discrepancy was found in 20% of malocclusion sample, whereas 17.2% of them exhibited clinically significant overall tooth size discrepancy.
- Frequency of tooth size discrepancy (anterior and overall) was the highest for Class III among different malocclusion groups though the results were not statistically significant.
| References | | |
| 1. | Kesling HD. The philosophy of the tooth-positioning appliance. Am J Orthod 1945;31:297-340.  |
| 2. | Lundstrom A. Intermaxillary tooth width ratio and tooth alignment and occlusion. Acta Odontol Scand 1955;12:265-92. [ PUBMED] |
| 3. | Neff CW. Tailored occlusion with the anterior coefficient. Am J Orthod 1949;35:309-13. [ PUBMED] |
| 4. | Bolton WA. Disharmony in tooth size and its relation to the analysis and treatment of malocclusion. Angle Orthod 1958;28:113-30. |
| 5. | Bolton WA. The clinical application of tooth-size analysis. Am J Orthod 1962;48:504-29. |
| 6. | Lavelle CL. Maxillary and mandibular tooth size in different racial groups and in different occlusal categories. Am J Orthod 1972;61:29-37. [ PUBMED] |
| 7. | Gelgor IE, Sisman Y, Malkoc S. Prevalence of dimensional anomaly in the permanent dentition. Turkiye Klinikleri J Dent Sci 2005;11:49-53. |
| 8. | Crosby DR, Alexander CG. The occurrence of tooth size discrepancies among different malocclusion groups. Am J Orthod Dentofacial Orthop 1989;95:457-61. |
| 9. | Nie Q, Lin J. Comparison of intermaxillary tooth size discrepancies among different malocclusion groups. Am J Orthod Dentofacial Orthop 1999;116:539-44. |
| 10. | Prasad K, Valiathan A. Model analysis-comparison of norms for Indians and Chinese using Bolton's index. J Indian Orthod Soc 1994;25:77-80. |
| 11. | Aggarwal SP, Gupta DS. Study of Bolton's analysis on North Indians. J Indian Orthod Soc 1978;10:1-3. [ PUBMED] |
| 12. | Angle EH. Classification of malocclusion. Dent Cosm 1899;41:248-57. |
| 13. | Moorrees CF, Thomsen SO, Jensen E, Yen PK. Mesiodistal crown diameters of the deciduous and permanent teeth in individuals. J Dent Res 1957;36:39-47. |
| 14. | Smith SS, Buschang PH, Watanabe E. Interarch tooth size relationships of 3 populations: Does Bolton's analysis apply? Am J Orthod Dentofacial Orthop 2000;117:169-74. |
| 15. | Araujo E, Souki M. Bolton anterior tooth size discrepancies among different malocclusion groups. Angle Orthod 2003;73:307-13. |
| 16. | Basaran G, Selek M, Hamamci O, Akkus Z. Intermaxillary Bolton tooth size discrepancies among different malocclusion groups. Angle Orthod 2006;76:26-30. |
| 17. | Richardson ER, Malhotra SK. Mesiodistal crown dimension of the permanent dentition of American Negroes. Am J Orthod 1975;68:157-64. [ PUBMED] |
| 18. | Uysal T, Sari Z, Basciftci FA, Memili B. Intermaxillary tooth size discrepancy and malocclusion: Is there a relation? Angle Orthod 2005;75:208-13. |
| 19. | Sperry TP, Worms FW, Isaacson RJ, Speidel TM. Tooth-size discrepancy in mandibular prognathism. Am J Orthod 1977;72:183-90. [ PUBMED] |
| 20. | Freeman JE, Maskeroni AJ, Lorton L. Frequency of Bolton tooth-size discrepancies among orthodontic patients. Am J Orthod Dentofacial Orthop 1996;110:24-7. |
| 21. | Santoro M, Ayoub ME, Pardi VA, Cangialosi TJ. Mesiodistal crown dimensions and tooth size discrepancy of the permanent dentition of Dominican Americans. Angle Orthod 2000;70:303-7. |
| 22. | Ta TA, Ling JY, Hägg U. Tooth-size discrepancies among different occlusion groups of Southern Chinese children. Am J Orthod Dentofacial Orthop 2001;120:556-8. |
| 23. | Tuverson DL. Anterior interocclusal relations. Part I. Am J Orthod 1980;78:361-70. [ PUBMED] |
| 24. | Rudolph DJ, Dominguez PD, Ahn K, Thinh T. The use of tooth thickness in predicting intermaxillary tooth-size discrepancies. Angle Orthod 1998;68:133-8. |
[Table 1], [Table 2], [Table 3], [Table 4], [Table 5]
|


 Search Pubmed for