
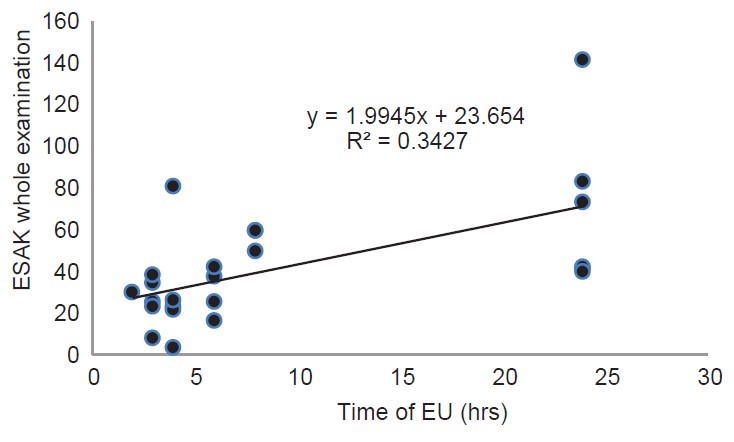
Figure 3: Scatter plot show a direct linear relationship between the entrance-surface air kerma and duration of excretion urography
| Close | |
|
|
|
|
Figure 3: Scatter plot show a direct linear relationship between the entrance-surface air kerma and duration of excretion urography
|
|