Close
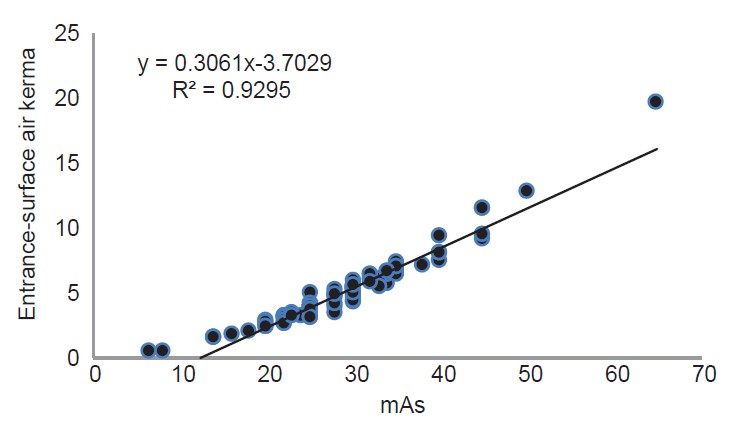
Figure 5: Scatter plot depict a linear relationship between the Kvp and patient age