
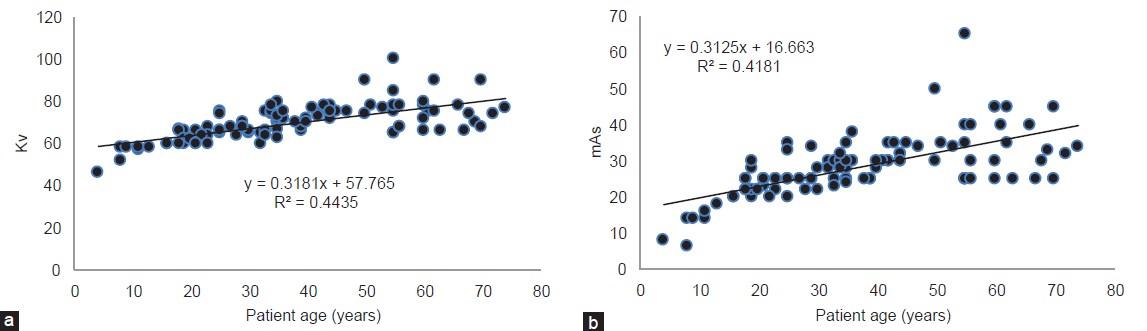
Figure 6: ( a) Scatter plot depict a linear relationship between the Kvp and patient age. (b) Scatter plot depict a linear relationship between the mAs and patient age
| Close | |
|
|
|
|
Figure 6: ( a) Scatter plot depict a linear relationship between the Kvp and patient age. (b) Scatter plot depict a linear relationship between the mAs and patient age
|
|