Copyright restrictions may apply. Please see our Conditions of Use.
| ||||||||||
|
Downloading the PowerPoint slide may take up to 30 seconds. If the slide opens in your browser, select File -> Save As to save it. Copyright restrictions may apply. Please see our Conditions of Use. |
|
|||||||||||
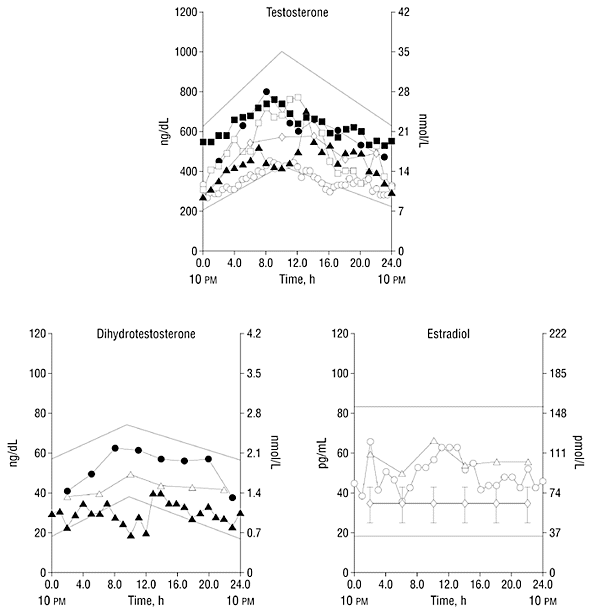
Figure 1. Mean curves and range of circadian patterns of testosterone, dihydrotestosterone, and estradiol in healthy young men. Dashed lines represent the 95% confidence range for the estimated circadian patterns. Symbols correspond to mean curves reported in different studies. Adapted with permission from Mazer et al.4