Copyright restrictions may apply. Please see our Conditions of Use.
| ||||||||||
|
Downloading the PowerPoint slide may take up to 30 seconds. If the slide opens in your browser, select File -> Save As to save it. Copyright restrictions may apply. Please see our Conditions of Use. |
|
|||||||||||

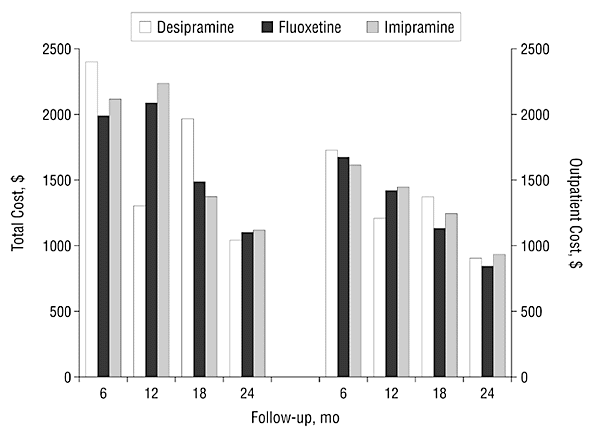
Figure 7. Time course of direct health care costs according to initial treatment assignment. Time labels represent the end of each 6-month period for which costs were calculated (n=494 for months 1-6, n=452 for months 7-12, n=434 for months 13-18, and n=397 for months 19-24).