Copyright restrictions may apply. Please see our Conditions of Use.
Click on image to view larger version.
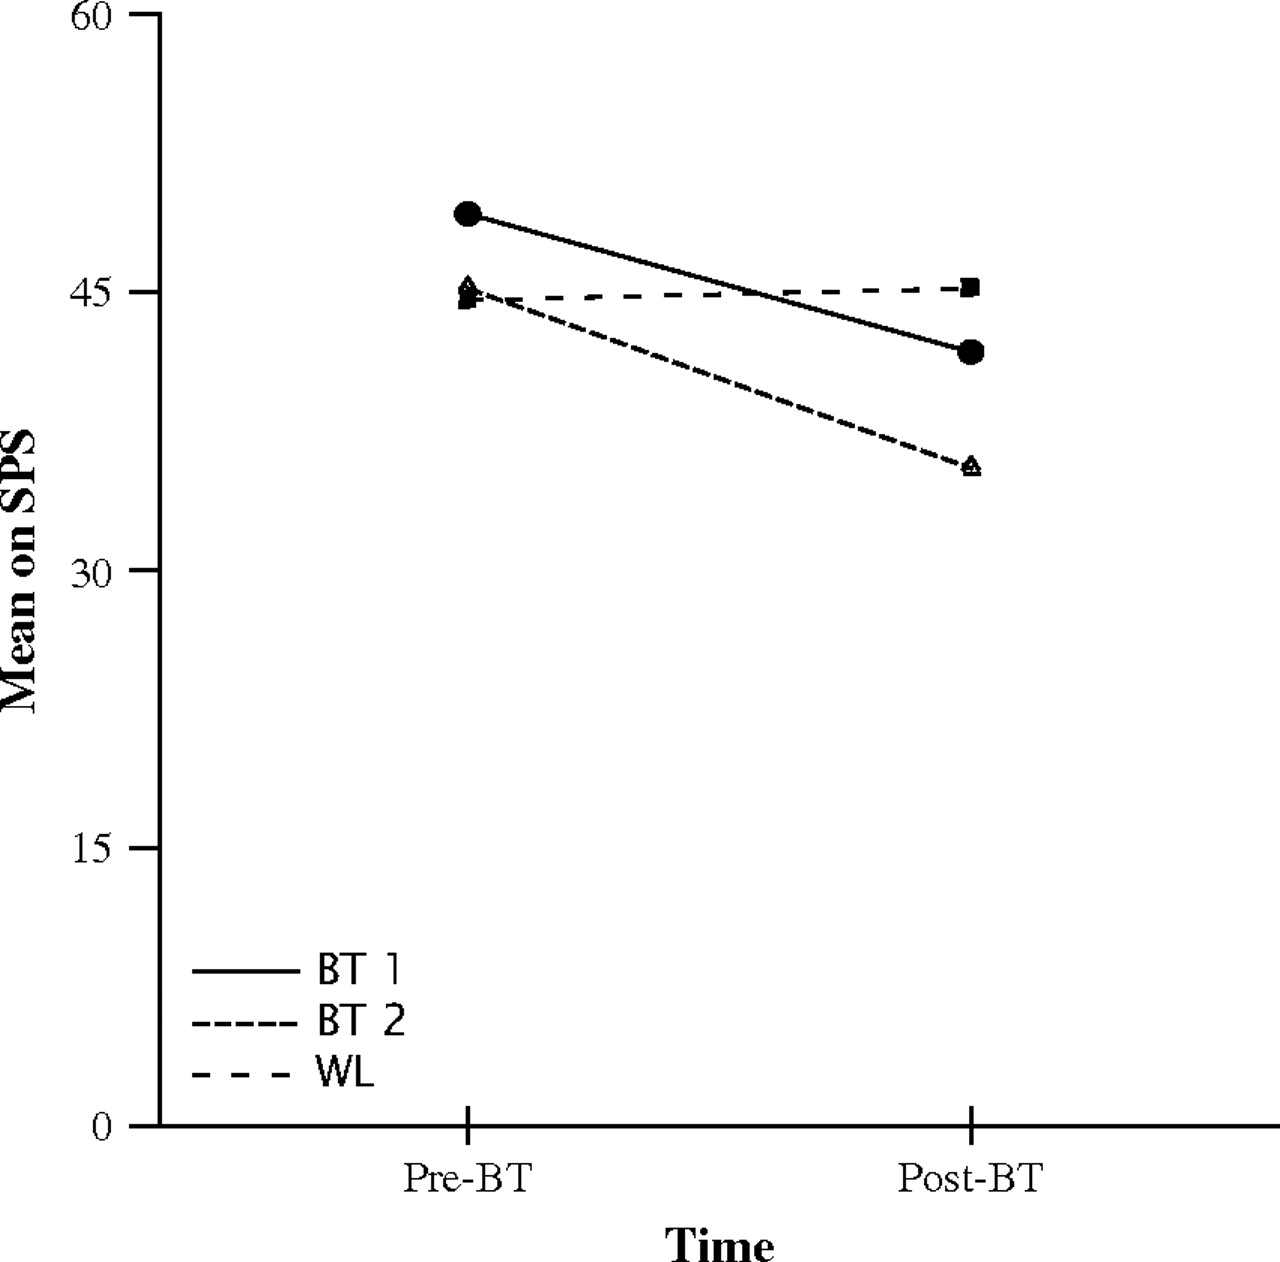
FIGURE 1 Group mean and interaction effect on SPS.
Note. The BT 1 and BT 2 groups exhibited a significantly higher reduction on the SPS than the WL group. There was no significant difference between BT 1 and BT 2.