


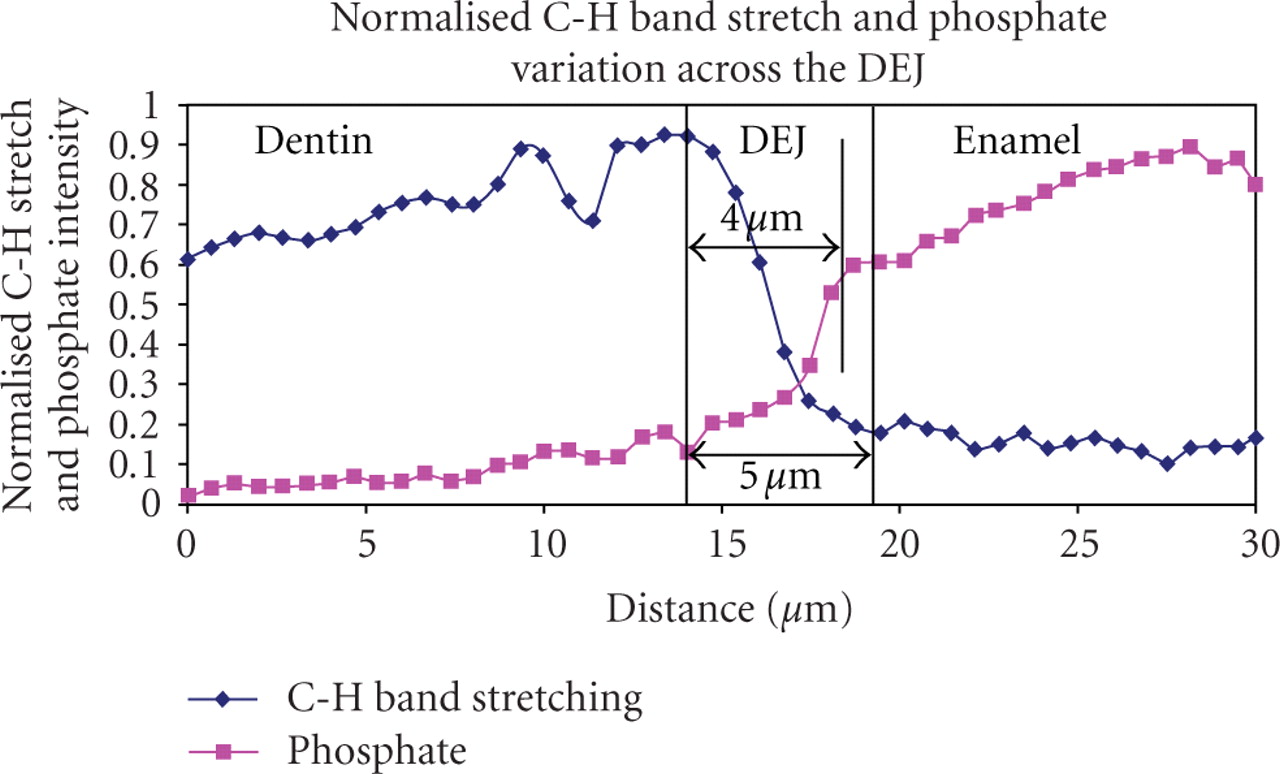
Figure 3
Typical normalized micro-Raman C–H stretch (2900 cm−1) and phosphate band (960 cm−1) peak intensity variations along a line oriented to cross the DEJ at a perpendicular angle. In this sample, DEJ width was estimated at 4 μm based on the peak phosphate band stretch intensity variation. Peak C–H stretching estimated DEJ width at 5 μm.