


Figure 4
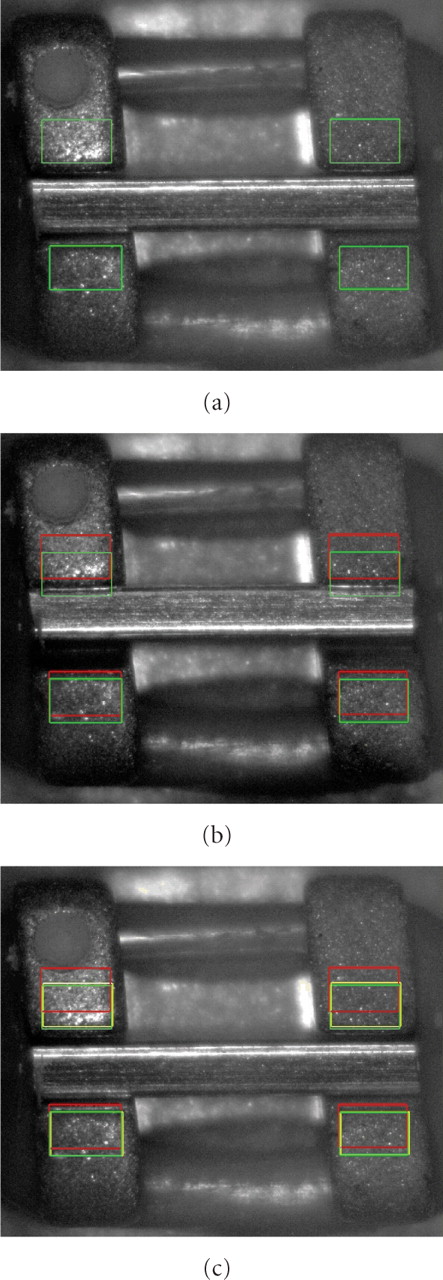
Image of brackets showing the location of tracked regions, (a) the original positions (green box), (b) maximum separation (red box) and (c) final, un-torqued location indicating permanent deformation (yellow box).
(Downloading may take up to 30 seconds. If the slide opens in your browser, select File -> Save As to save it.)
Click on image to view larger version.
Image of brackets showing the location of tracked regions, (a) the original positions (green box), (b) maximum separation (red box) and (c) final, un-torqued location indicating permanent deformation (yellow box).
 CiteULike
 Connotea
 Delicious
 Digg
Digg Facebook
 Google+
 LinkedIn
 Mendeley
 Reddit
 StumbleUpon
 Technorati
 Twitter