


Figure 15
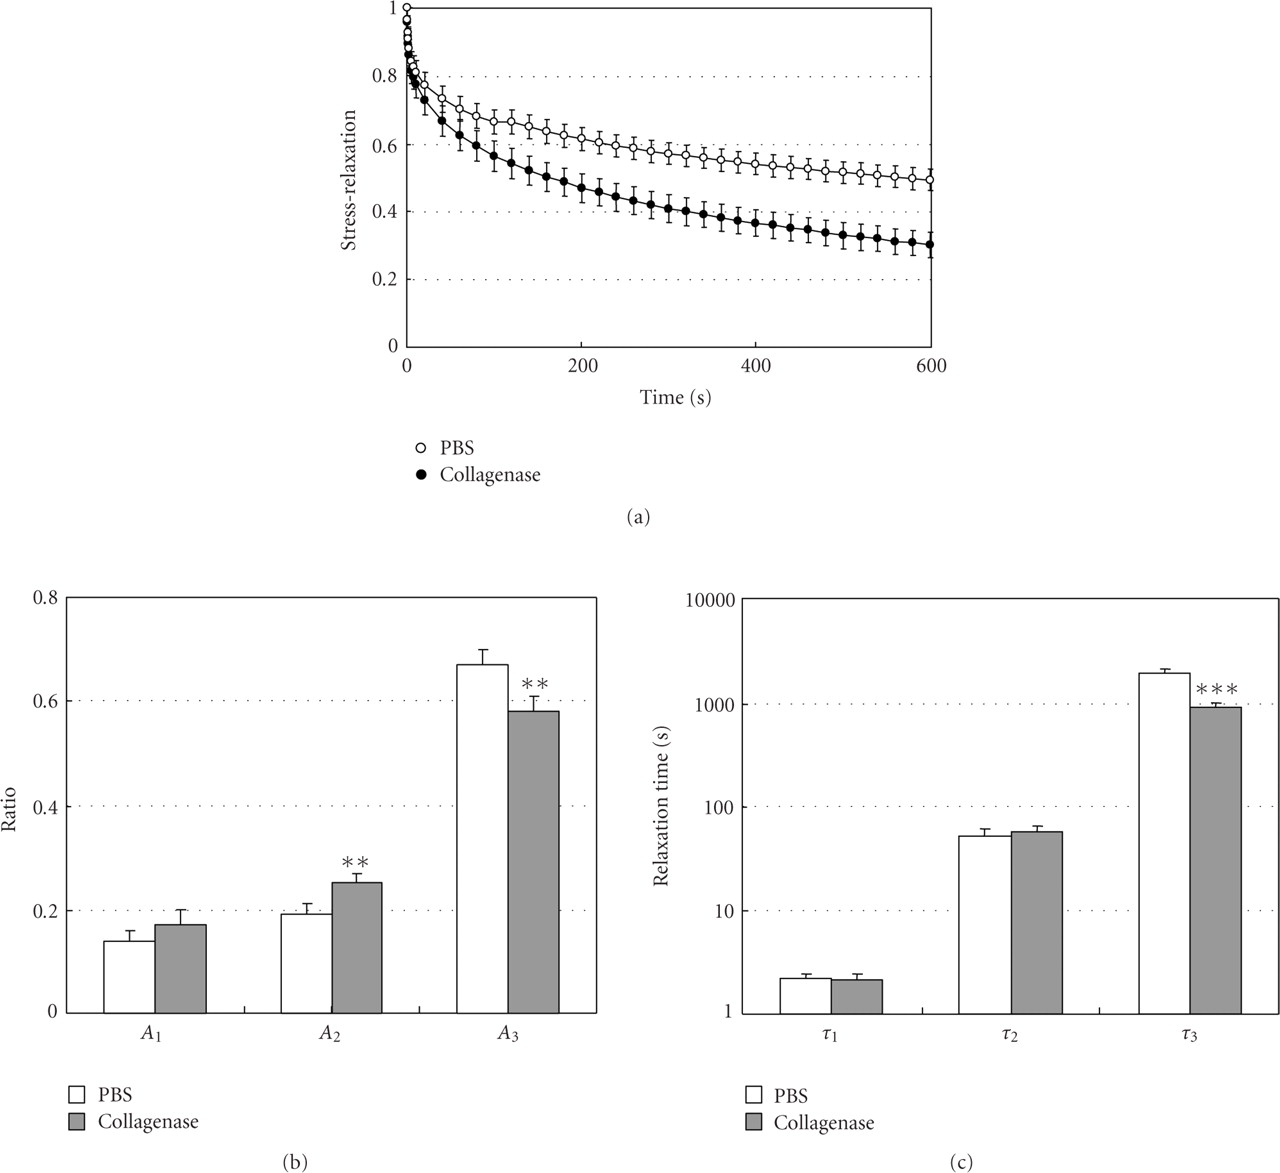
(a) Stress-relaxation curves as represented by
 for specimens
treated with PBS or 8 units/mL collagenase, reproduced from Komatsu
et al. [77],
by permission. Measured values
for specimens
treated with PBS or 8 units/mL collagenase, reproduced from Komatsu
et al. [77],
by permission. Measured values  are well
expressed by an equation:
are well
expressed by an equation:  .
(b) Ratios (Ai) and (c)
relaxation times (
.
(b) Ratios (Ai) and (c)
relaxation times ( )
of the three exponential decay functions. Each column and vertical
bar represent the mean + 1 SD.
)
of the three exponential decay functions. Each column and vertical
bar represent the mean + 1 SD.  and
and  compared with the PBS group.