Quasi-Static and Harmonic Indentation of Osteonal Bone
- S. S. Huja huja.1{at}osu.edu1
- J. L. Hay jenny.hay{at}agilent.com2
- A. M. Rummel drewrummel{at}hotmail.com3
- F. M. Beck beck.7{at}osu.edu1
Abstract
The purpose of the study was to compare Quasi-Static (QS) and harmonic (CSM) methods of indentation testing. Bone sections were obtained from mid-femoral diaphyses of dogs which received a pair of calcein labels. Labeled (n = 35) and unlabeled (n = 112) osteons were identified. Indentation modulus (IM) and hardness (H) for the CSM method were collected during the entire loading cycle to peak depth, while IM and H for QS method were calculated at a peak depth of 500 nm. Results: The mean (SD) of the IM and H for labeled osteons were as follows: QS IM = 15.3 GPa (3.85) versus CSM IM = 14.7 GPa (3.58); P = .52 and QS H = .39 GPa (.171) versus CSM H = .42 GPa (.146); P = .32. The mean (SD) of the IM and H for unlabeled osteons were as follows: QS IM = 21.5 GPa (2.80) versus CSM IM = 20.6 GPa (2.53); P = .054 and QS H = .64 GPa (.117) versus CSM H = .70 GPa (.120); P = .017. There was no difference in IM and H for the two methods, except for H of the unlabeled osteons. In addition, for the CSM method, IM at 100 nm, 200 nm, 300 nm, 400 nm and 500 nm were not statistically significant different (P = .06). Bone is viscoelastic at an organ level. However, this component of its behavior was not detected at the length scale examined.
1. Introduction
Instrumented-indentation testing (also known as nanoindentation) has been used to investigate the mechanical properties of biological tissues such as bone [1–3], dentin [4] and enamel [5]. In the literature, there is no single protocol to measure the material properties of mineralized tissues by instrumented indentation [6, 7]. Results cited in the literature have been achieved using a variety of control mechanisms, force application rates, termination criteria, and analyses [2, 5, 8, 9]. To what extent are results from such disparate methods comparable? Are there sound reasons for preferring one method over another? While such questions remain unanswered, our ability to compare and interpret results from different studies is hindered. Therefore, the primary purpose of this work was to determine the sensitivity of indentation results to test method in order to increase the value of results reported by us and others.
Rather than examining every permutation of indentation method and bone type, we examined two identifiable extremes in indentation method (quasi-static and harmonic) for each of two extremes in bone mineralization (young and old osteons). We hypothesized no significant differences in properties as a function of indentation method but significant difference in properties as a function of mineralization. If this hypothesis is upheld, we may conclude that it is valid to compare micron scale properties measured by most indentation methods that are commonly used today.
The organ level material properties of bone are heterogenous and depend upon age [10] anatomical location [11], species and bone activity [12]. To span the identifiable extremes of variation in mineralization that can be apparent in bone we examined bone sections that were administered intravital bone labels. This allowed us to distinguish newly forming, younger, incompletely mineralized labeled osteons with older, more completely mineralized unlabeled osteons, a strategy we have used successfully in the past [12].
Indentation test methods may be broadly classified as quasi-static (QS) or harmonic (CSM), the primary difference being the
means by which contact stiffness, S, is determined. A QS method involves monotonically pressing the indenter into the test surface, holding for a dwell time,
and then withdrawing the indenter. (Note: This cycle may be controlled based on either force or displacement.) Pressing the
indenter into the test surface causes both elastic and plastic deformation but as the indenter is withdrawn, the material recovers elastically.
For time-independent materials the contact stiffness is determined as the relationship between force reduction and recovered
displacement at the onset of withdrawal. A CSM method also involves pressing the indenter into the test surface, dwelling,
and withdrawal, but superimposed upon the pressing part of the test cycle is a small oscillation in force of amplitude Fo. A frequency-specific amplifier is used to sense the resulting displacement oscillation. The amplitude of the force oscillation
is controlled so that the amplitude of the resulting displacement oscillation,  , maintains a constant value of just a few nanometers. (As the size of the contact increases the amplitude of the force oscillation
must increase in order to maintain constant amplitude for the displacement oscillation.) Generally, oscillation frequencies
from 1–300 Hz may be used, but when testing biological materials, frequencies above 45 Hz are rarely used. With a CSM method,
contact stiffness is determined continuously during the “pressing” part of the test cycle from the amplitude ratio,
  . This technique is described in detail elsewhere [13]. To summarize, with a QS method, the contact stiffness is determined as the slope of the unloading curve; with a CSM method,
the contact stiffness is determined continuously during loading from the amplitude ratio of a superimposed oscillation. The
acronym “CSM” stands for “continuous stiffness measurement”. It should be noted that both the QS and CSM methods may be implemented
in a single indentation test, because the oscillation required for the CSM method is so small that it does not interfere with
the quasi-static cycle. When both methods are implemented in a single test, the CSM method is used to continuously measure
contact stiffness during loading, and the QS method is used to determine a single value of contact stiffness from the unloading
force-displacement data. For materials which do not manifest time-dependent elasticity (viscoelasticity), these two different
techniques for measuring contact stiffness yield the same measure of indentation modulus. This is true for most ceramic and
glassy materials, but the extent to which this is true for bone has yet to be demonstrated.
Once the contact stiffness, S, has been determined by either method, the analyses for calculating indentation modulus (IM) and indentation hardness (H) are the same. However, because the QS method yields only one value of S, it can yield only one value of IM and H at the maximum penetration depth, whereas the CSM method yields a continuous measure of IM and H as a function of surface penetration (or applied force). Regardless of how S is determined, calculations of IM and H proceed as follows [13].
The depth over which the test material makes contact with the indenter,  , is calculated as:
 where h is the indenter displacement as measured from the point of initial contact, P is the applied force, and S is the contact stiffness. The contact depth,
  , is less than the total depth, h, because the material around the indenter deflects downward elastically. For a Berkovich indenter, the contact area, A, is calculated as

This expression for A is approximate because the real expression is slightly different for every physical diamond. The exact form of the expression
for A is determined by indenting a material with known modulus. The reduced modulus, Er, includes bidirectional displacements in both the indenter and the test sample, and is calculated as [14]
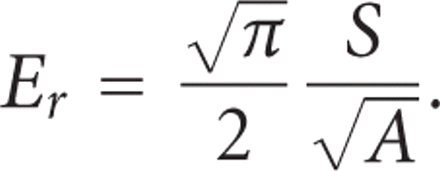
And the indentation elastic modulus (IM) of the sample is calculated from the reduced modulus as
 where ν is the Poisson's ratio of the test sample, and
  and Ei are the Poisson's ratio and elastic modulus of the indenter, respectively. If the indenter is diamond, then
  and Ei are 0.07 and 1140 GPa, respectively. Although the calculation of IM requires knowing the Poisson's ratio of the sample (ν),
the sensitivity is weak. Sensitivity analysis reveals that a generous uncertainty of 40% in the Poisson's ratio manifests
as only a 5% uncertainty in IM. For all the results reported in this work, a value of 0.3 was used for ν. Finally, indentation
hardness (H) is calculated as
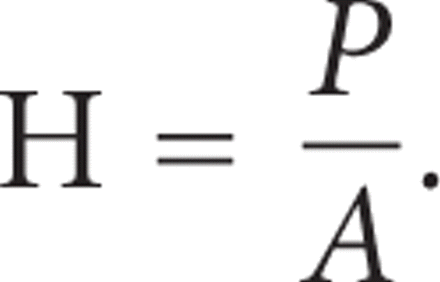
2. Materials and Methods
2.1. Materials
Tissue specimens were obtained from another study which had Institutional Animal Care Committee approval. Calcein (Sigma St.
Louis, MO) bone labels (5 mg/kg body weight) were administered intravenously to five skeletally mature (1-2 years) male Beagle
dogs. The labels were given two weeks apart, that is, 17 days and 3 days prior to euthansia. The femurs were harvested immediately
after euthanasia and frozen in saline soaked gauze at  for a brief storage period [15]. Two ∼3 mm mid femoral bone slices were obtained from each dog.
2.2. Specimen Preparation
The method for sample preparation and osteon identification and localization have been described in detail in a recent publication [12]. Briefly, just prior to mechanical testing, the femurs were thawed and approximately 3 mm thick bone slices were obtained from the mid-diaphyseal region of the femur on a band saw. The femoral cross sections were examined under an epifluorescent microscope (Olympus BX 51, Tokyo, Japan) to confirm the presence of labeled osteons in that bone slice being examined. Among the labeled osteons we chose those that were approximately half way or greater in their bone formation cycle [12]. This allowed us adequate bone tissue to place the indents.
The selected femoral bone surfaces were then lightly polished [2, 8], and care was taken to prevent overpolishing of the specimens [16, 17]. This is very important in this study and thus we describe the standard polishing procedure used in our laboratory. The bone block was glued into a well of a custom-made polycarbonate specimen holder. The mounting was verified on a certified level stage to ensure parallelism. The sectioned specimens were wet-polished on a rotary wheel (Ecomet, Buehler, Lake Bluff, IL) at 120 rpm with 2,400 grit SiC papers. Additional polishing was done on a napless cloth (OP-Chem, Struers A/S, Rodovre, Denmark) with diluted 0.3 μm and 0.05 μm alumina oxide pastes (Micropolish C alpha Alumina, Buehler, Lake Bluff, IL). The specimens were sonicated for 2 minutes. The polishing was restricted to the minimum time to allow for examination of the detailed morphological features (e.g., lamellae, cement lines) of the cortical bone; after polishing, surface roughness was less than 30 nm.
Next, we identified and mapped the coordinates of the labeled and unlabeled osteons under an epifluorescent microscope. This
was essential as labeled osteons cannot be identified under the optics of the indenter system. Multiple perpendicular lines
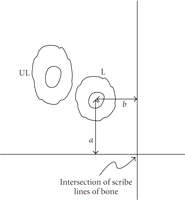
(Figure 1) were scribed into the surface of the polished bone specimen with a surgical blade [12]. The exact location ( coordinates) of the central Haversian canal of the labeled osteon relative to two orthogonal scribe lines was measured in
microns using a linear microscope eyepiece of the epifluorescent microscope. In addition, photomicrographs aided in documenting
the unique cross sectional morphology of each labeled osteon site and its neighboring osteons and other structures such as
blood vessels.
Schematic of method to locate osteons. Multiple orthogonal scribe lines (only one shown) were cut into the polished bone surface.
A labeled osteon was identified under the epifluorescent microscope and the perpendicular distances ( ) from the axes to the center of the Haversian canal were measured. These distances were recorded and once the specimen was
placed under the optics of the indenter microscope, the coordinates to the center of the osteon measured from the intersection
of the scribe lines were entered into the indenter software. This procedure verified the previously identified labeled osteon.
A neighboring unlabeled osteon was identified based on its morphology and proximity to the labeled osteon.
After the bone slice was mounted in the indenter (Nano Indenter XP, Agilent Technologies, Inc., Oak Ridge, TN), the photographic
map produced from the epifluorescent microscope was referenced. A specific labeled osteon was located using the intersection
of nearest two perpendicular lines from the osteon (Figure 1). The indenter optics were moved to the intersection of the two perpendicular lines and  coordinates to the center of the labeled osteon in microns were entered into the software. The sample was then translated
to present the desired test location to the indenter optics. The photographic map confirmed the specific osteon of interest
and a neighboring unlabeled osteon (Figure 2).
Pair of images (a) Brightfield and (b) Epifluorescent of cortical bone from a dog femur. Osteonal architecture of bone is evident. In addition labeled and unlabeled osteons can be clearly distinguished. The reversal lines and bone labels clearly demarcated the labeled and unlabeled osteons.
The above described procedure was repeated to locate additional labeled and unlabeled osteons on the bone slice (Figure 2). Each location was flagged into the computer with one set of coordinates for each labeled osteon. After all osteons that we desired to examine were located, we then programmed the software to place indents on the bone of the osteons. The indents were located approximately half the distance between the reversal cement line and the central canal for all the osteons. This is because each osteon does not have the same dimension in each cross section and osteons were sampled at different times during their formation phase. We made 5-6 indents on each labeled and unlabeled osteon.
After identification of all the labeled and unlabeled osteons the hydration system was turned on. A hydration fluid containing a mixture [8] of distilled water and 0.5 mg/mL of gentamicin sulphate (Sigma Chemical Company, St. Louis, MO). The specimens were kept moist for the entire test. A total of 147 osteons (labeled = 35; unlabeled = 112) were measured.
All indentation testing was performed using a Berkovich indenter at room temperature. Proper functioning of the indentation tester was verified by testing fused silica prior to testing bone. Some tests (<5%) did not commence due to inability of the machine to detect contact, and occasionally, the target depth was exceeded (e.g., greater than 530 nm) and such tests were eliminated [12]. A total of 610 indents were made on the 35 labeled osteons and 112 nonlabeled osteons.
Quasi-Static Method (QS)
Each indentation test comprised the following segments [18].
-
(0) The indenter approaches the test surface until contact is sensed.
-
(1) The indenter is pressed into contact with the test material at a rate of 10 nm/sec to a peak depth of 500 nm.
-
(2) The force on the indenter is held constant for a dwell time of 30 seconds.
-
(3) The indenter is withdrawn from the sample completely, and the sample is moved into position for the next test.
A single value of contact stiffness is calculated from the slope of the unloading curve as explained in the introduction. IM and H are calculated from this single value of S.
Harmonic Method (CSM)
Superimposed upon the quasi-static loading segment (1) was a small oscillating force at 45 Hz. The amplitude of the oscillating force, Fo, was continuously adjusted in order to maintain the amplitude of the resulting displacement oscillation at  = 2 nm. Contact stiffness was determined continuously during loading from the amplitude ratio
  . IM and H were calculated using this continuous measure of S. For the purpose of comparing with QS results, CSM results for IM and H were taken at the maximum displacement of 500 nm.
2.3. Statistical Analyses
The data were analyzed using multiple, repeated measures ANOVA. The independent variables were osteonal type (labeled, unlabeled) or the method (QS, CSM). The repeated factor was dog. Data for depth analyses for the CSM method were analyzed by a repeated measures, factorial analyses of variance with depth and type of osteon (labeled, unlabeled) as two factors and dog as the repeated factor.
3. Results
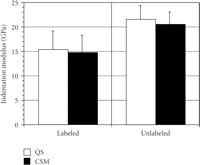
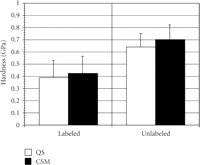
The mean (SD) of IM (Figure 3) and H (Figure 4) for labeled osteons obtained by the two indentation methods were as follows:
-
(i) QS IM = 15.3 GPa (3.85) versus CSM IM = 14.7 GPa (3.58);
 , and
, and
-
(ii) QS H =.387 GPa (.171) versus CSM H =.422 GPa (.146);
 .
.
The mean (SD) of IM (Figure 3) and H (Figure 4) for unlabeled osteons were as follows:
-
(i) QS IM = 21.5 GPa (2.80) versus CSM IM = 20.6 GPa (2.53);
 , and
, and
-
(ii) QS H =.639 GPa (.117) versus CSM H =.700 GPa (.120);
 .
.
Mean (SD) of indentation modulus (GPa) for labeled and unlabeled osteons derived by the two methods, quasi-static (QS) and
continuous stiffness measurement (CSM). There are no difference in the IM between the two methods for the labeled ( ) and unlabeled (
 ) osteons.
Mean (SD) of indentation modulus (GPa) for labeled and unlabeled osteons derived by the two methods, quasi-static (QS) and
continuous stiffness measurement (CSM). The hardness was not significantly different for the two methods for the labeled ( ) but different for the unlabeled osteons (
 ).
).
No difference in IM existed between the two methods for either type of bone, but statistically significant differences were found for H between methods for unlabeled osteons. CSM hardness values were 9% and 8% higher then QS hardness values for unlabeled and labeled osteons, respectively.
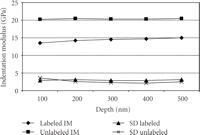
ANOVA showed significant ( ) differences between labeled and unlabeled osteons. The CSM method allows the determination of properties as a function of
depth. However, there was no statistically significant difference for the IM with depth (
 ) and there was no (
 ) depth/type of osteon interaction (Figure 5). With the CSM method, IM (SD) for the labeled osteons increased from 13.2 (3.9) GPa at 100 nm to 14.76 (4.12) GPa at 500
nm depth (Figure 5). However, IM (SD) for the unlabeled osteons only increased from 20.51 (5.5) GPa at 100 nm to 20.57 (3.5) GPa at 500 nm.
4. Discussion
Although the primary focus of this study was test method, we have confirmed previous data [12] which showed IM and H of unlabeled osteons to be greater than labeled osteons by approximately 30%.
Since the primary focus of this study was determining the sensitivity of measured properties to test method, it was critical that the QS and CSM methods be implemented together in a single test. Implementing the methods simultaneously eliminated variables of test condition that can influence results, including tip wear, temperature, test site, and degree of tissue degradation. For example, if all the QS tests were performed in one batch, and all the CSM tests were performed in a later batch, and different results were obtained (for like materials) from the two batches, questions would remain as to whether the differences were due to variations in test method (QS or CSM) or test condition. By eliminating variables of test condition, we are able to attribute any observed property differences (for like materials) to test method and fundamental material behavior.
Although we found statistically significant differences in the properties of labeled and unlabeled bone, we found no significant difference in the IM by method. From this observation, we deduce that at the resolution of testing, bone tissue does not exhibit significant viscoelastic behavior, that is, the elastic strain response to stress occurs instantaneously. This conclusion, though far-reaching, is warranted by the breadth of this study. The labeled and unlabeled osteons represent identifiable low and high degrees of mineralization in bone, respectively. The fact that the QS and CSM methods yielded statistically equal measures of IM for osteons at opposite ends of the identifiable spectrum of mineralization causes us to include various levels of physiologic mineralization of bone in this conclusion. Furthermore, the QS and CSM test methods represent extremes of physiological frequencies. The QS method quantifies long-time (10 seconds) response, and the CSM method quantifies short-time (0.022 second) response. The fact that these two methods yielded no statistically significant difference in IM causes us to include all physiologically interesting frequencies in this conclusion. Bone may well be viscoelastic at an organ level [19–21]. At an organ level, blood vessels, lacunae, fluid-filled channels/canaliculi, and the larger volume of collagen matrix may all contribute to a viscoelastic nature. However, dynamic testing of a whole femur from a 65-year-old female subject revealed only slight viscoelasticity; the loss modulus was about 5% of the Young's modulus, and the Young's modulus was nearly independent of frequency [22]. We should expect even less viscoelasticity at the scale of the test within the individual osteons. Thus, our conclusion is not so surprising, as the imprint diameter of a 500-nm indentation test is approximately 4–5 microns. The conclusion that bone tissue does not demonstrate significant viscoelasticity at this scale is relevant, because a frequent critique to testing bone by indentation is that analytic models for interpreting indentation data might not properly account for viscoelastic behavior. Whether or not such a critique is generally valid, the present study reveals that it is irrelevant for bone tissue at the scale of testing undertaken in this study. At this point, it is important to note that our tests were conducted under moist conditions for the entire test period, by means of a custom hydration system [12, 23]. We believed that it was important to conduct tests in this way so as not to artificially mitigate viscoelasticity.
Although the two test methods yielded no significant difference in IM, the two test methods did yield slightly but significantly
different measures of H for the unlabeled (old) osteons. For the unlabeled osteons, the H obtained by the CSM method was 9%
greater than that obtained by the QS method. (Although the same trend was observed for the labeled osteons, the difference
was not quite large enough to be considered statistically significant.) Logistically, this can be explained by the fact that
during the 30-second hold segment (2), the indenter penetration continued to increase, even while the force on the indenter was held constant. Hardness (H) is
calculated as load divided by area ( ). The CSM value of H was obtained immediately prior to the hold segment, while the QS value of H was obtained after the hold
segment. Over the course of the hold segment, applied load (P) remained constant, but the contact area increased, so the QS method returned a lower value of hardness. But what is the
underlying cause of this relaxation? Because we provide evidence suggesting the lack of significant viscoelasticity, we must
conclude that it is due to viscoplasticity. The plastic (or nonrecoverable) strain response to stress does not occur instantaneously, but rather, over a period of time.
In other words, bone tissue does creep, and this tendency is potentially greater in older bone. Our findings are in agreement
with another indentation study of osteonal bone, in which authors found that the dominant time-dependent deformation mechanism
for bone was viscoplasticity [24]. Future work should focus on achieving a better understanding of this tendency.
Our protocol has been to make indents to a maximum depth of 500 nm, as this mitigates the consequences of surfaces roughness, which is 30 nm or less. However, the CSM method returns properties as a continuous function of indentation depth. For the labeled osteons, the value of IM at 500 nm was 6% higher than the value measured at 100 nm; however, this difference is not large enough to be statistically significant and may have biologic implications. For the unlabeled osteons, there was no perceptible trend in IM with depth; values measured at 100 nm were equal to those measured at 500 nm. This lack of depth dependence causes us to conclude that architectural features of bone as small as ∼1 micron wide could be tested with indentations as small as 100 nm.
This study revealed that IM is largely independent of test method. Therefore, we may conclude that virtually any indentation method commonly used today will return the same value for IM for the same material under the same test conditions. However, because bone tissue at this scale does exhibit viscoplasticity, hardness measurements will be sensitive to test method. Hardness measurements should be compared only if they have been determined by the same method.
5. Conclusion
This study confirms that new and old osteons have significantly different indentation properties. In addition, we conclude the following.
-
(i) Bone at the scale of testing described in this study, does not exhibit significant viscoelastic behavior.
-
(ii) At this scale of testing, bone is viscoplastic; older bone is more so.
-
(iii) IM values determined by different test methods are comparable, so long as test conditions are similar.
-
(iv) H values should not be directly compared unless they have been measured by the same method.
Determining the material properties of biologic tissues such as bone, enamel, dentin and cementum is challenging. In this paper we present data and compare two techniques for testing the material properties at the scale of individual osteons. The techniques presented could be applied to other biologic tissues. Such spatially resolved testing may eventually allow us to understand the relationship between structure and function of organic and inorganic phases of mineralized tissues.
- Received March 19, 2009.
- Revision received August 4, 2009.
- Accepted November 17, 2009.
- © 2010 S. S. Huja et al.

