


Figure 4
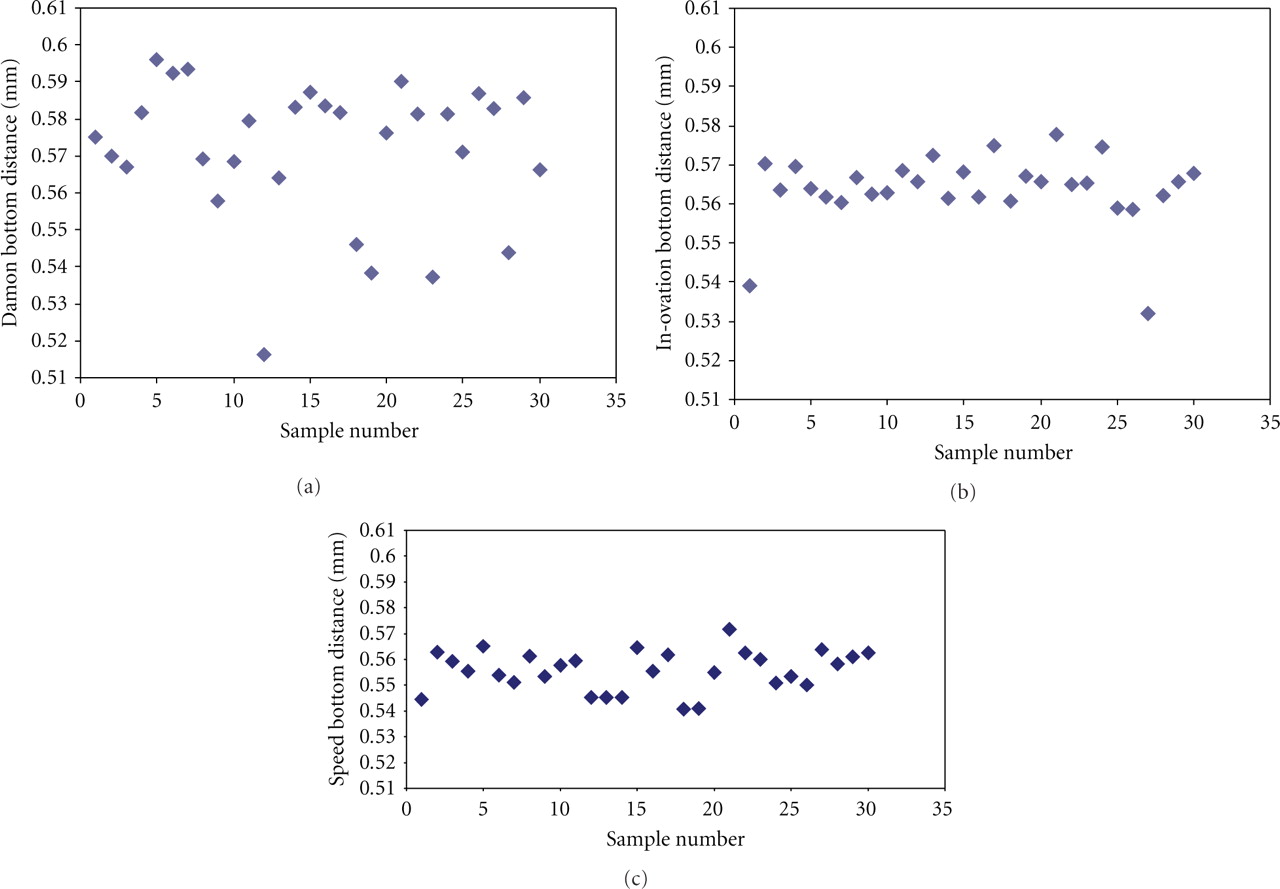
Scatter plot of Damon, In-Ovation, and Speed brackets showing distribution of data for measured bottom distance: (a) Damon Q bracket, (b) In-Ovation R bracket, and (c) Speed bracket.
(Downloading may take up to 30 seconds. If the slide opens in your browser, select File -> Save As to save it.)
Click on image to view larger version.
Scatter plot of Damon, In-Ovation, and Speed brackets showing distribution of data for measured bottom distance: (a) Damon Q bracket, (b) In-Ovation R bracket, and (c) Speed bracket.
 CiteULike
 Connotea
 Delicious
 Digg
Digg Facebook
 Google+
 LinkedIn
 Mendeley
 Reddit
 StumbleUpon
 Technorati
 Twitter