


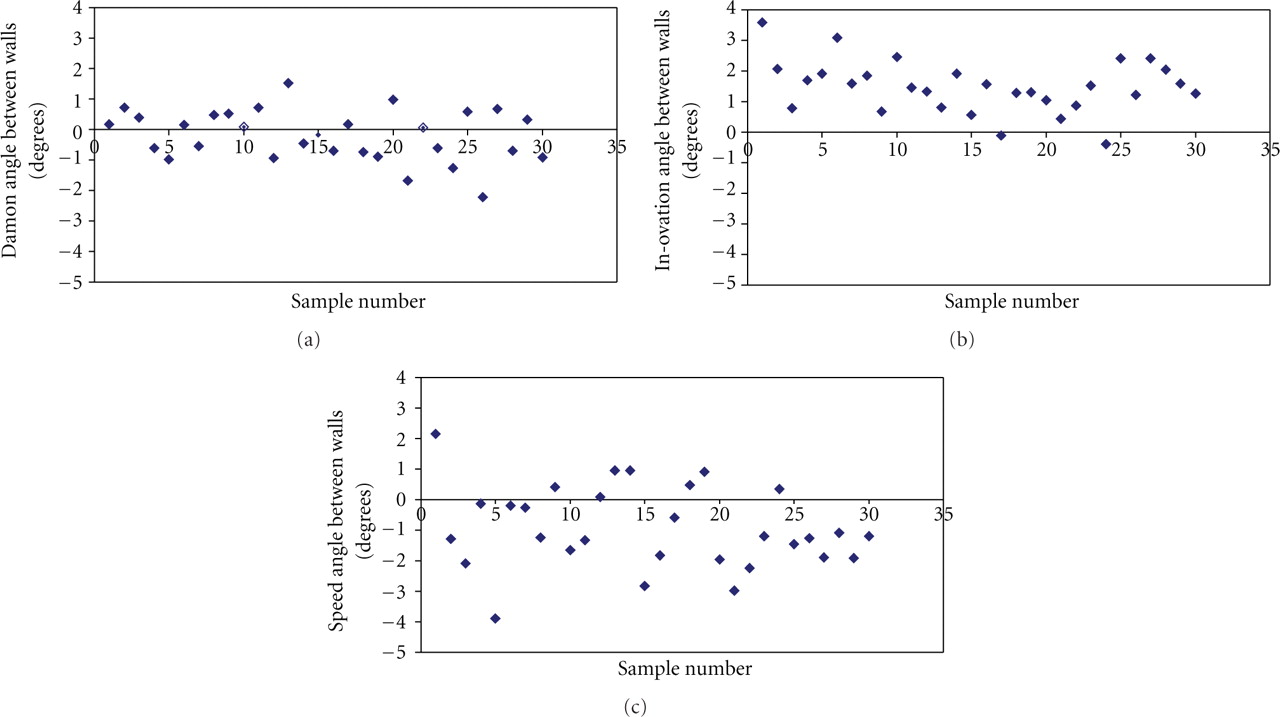
Figure 5
Scatter plots of Damon, Speed, and In-Ovation brackets showing the distribution of data for the difference between measured left and right slot angles: (a) Damon Q bracket, (b) In-Ovation R bracket, and (c) Speed bracket.