


Figure 4:
Biochemical analysis of the TMJ disc ( goats ×
  regions) and MCC (
 goats ×
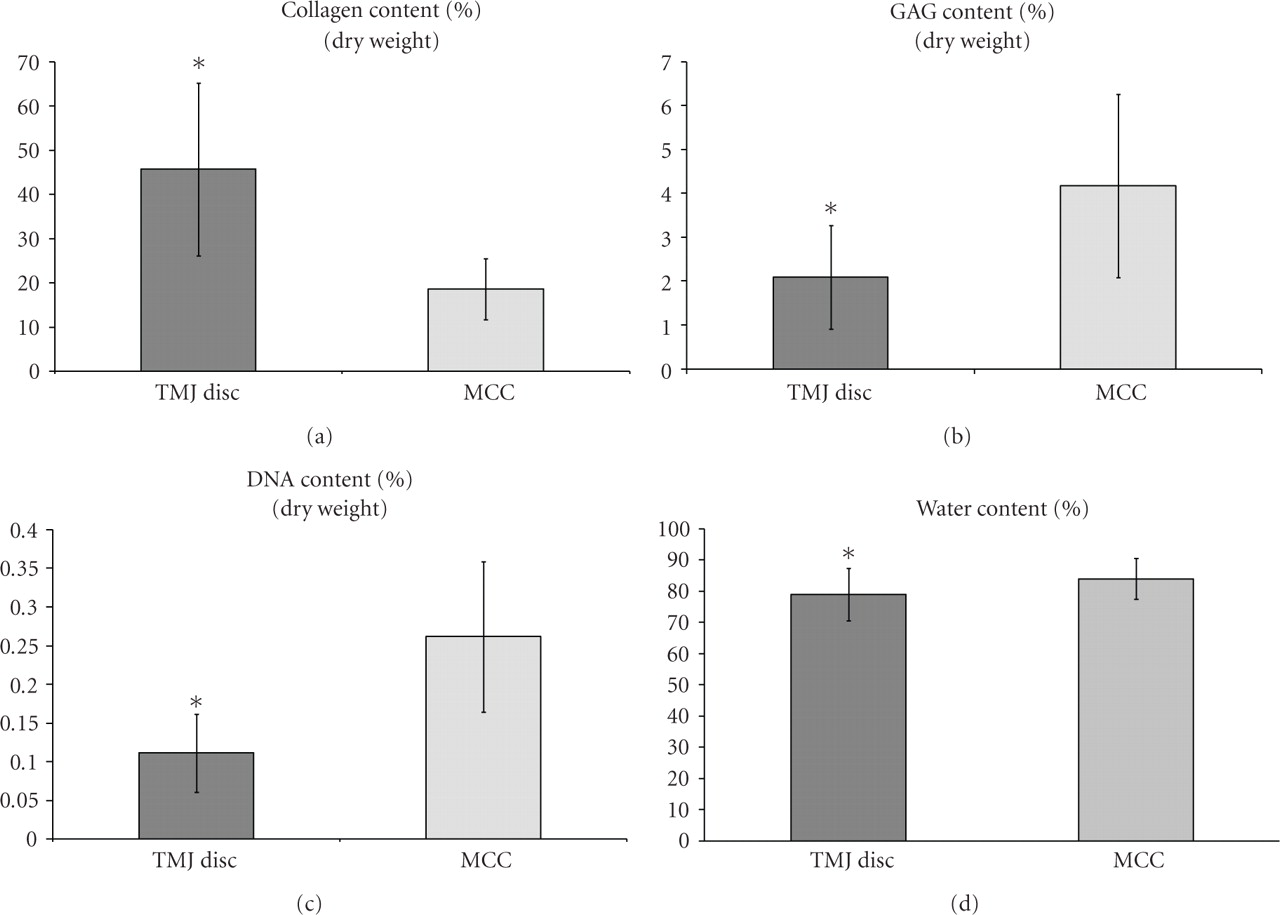
  regions). (a) Percent collagen content per dry weight. (b) Percent GAG content per dry weight. (c) Percent DNA content per
dry weight. (d) Percent water content of the tissue. The symbol (∗) indicates significance (
regions). (a) Percent collagen content per dry weight. (b) Percent GAG content per dry weight. (c) Percent DNA content per
dry weight. (d) Percent water content of the tissue. The symbol (∗) indicates significance ( ) between the TMJ disc and MCC. Error bars indicate S.D.