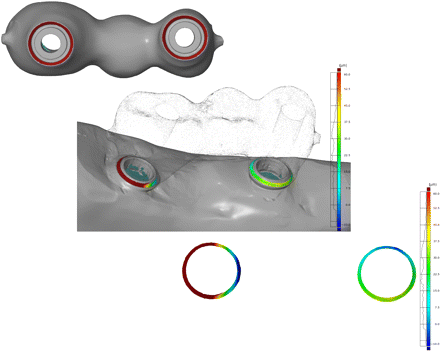
Figure 4.
Screenshot of intaglio view of implant framework with exemplary surfaces selected for measurement of gap dimension (marked circles, top image). For illustration purposes, framework surface is made translucent, to display the location of measurement area (middle image) and exclusive view of measured gap dimensions with distribution chart (bottom image). Note the inhomogeneous distribution of gap dimensions.


