


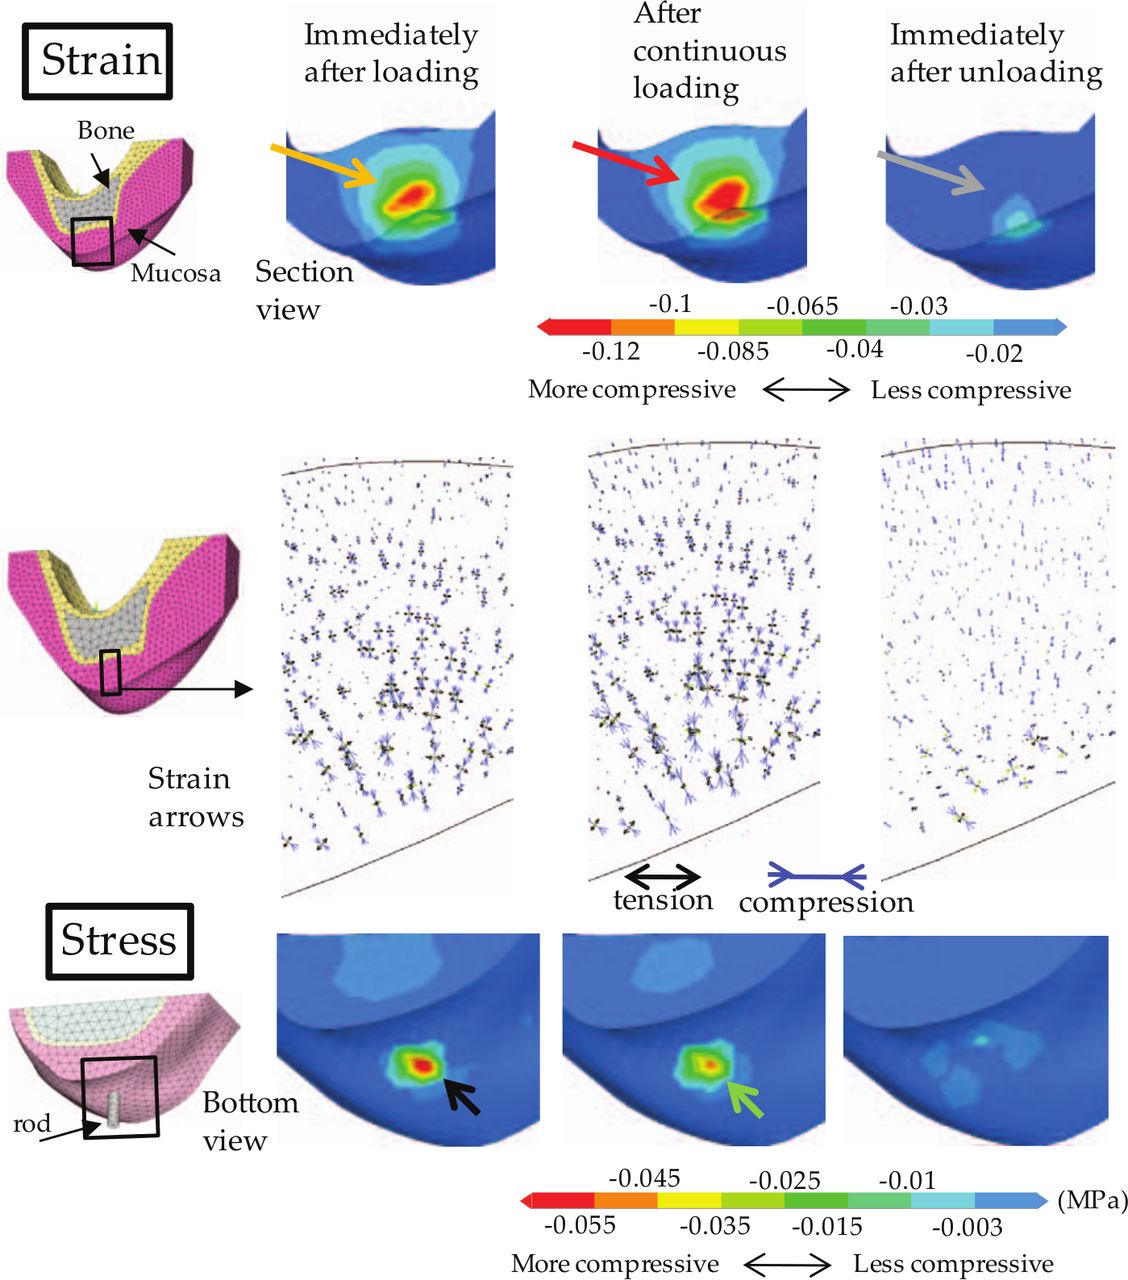
Figure 4.
The strain and stress distributions. Left figures indicate the regions of interest by black boxes. The graphics indicate, from left to right, the contours at the time immediately after onset of loading, after the 10-s continuous loading, and at the time immediately after the unloading. The contours on the upper row represent the maximum compressive strain. The arrow graphics on the middle row show the strain directions. The contours on the bottom indicate the maximum compressive stress.