Three-dimensional deformation of orthodontic brackets
- 1Department of Mechanical Engineering, Faculty of Engineering, University of Alberta, Edmonton, AB, Canada
- 2Department of Dentistry, Faculty of Medicine and Dentistry, Dentistry/Pharmacy Centre, University of Alberta, Edmonton, AB, Canada
- Jason P Carey, Department of Mechanical Engineering, 5-8T, Mechanical Engineering Building, Faculty of Engineering, University of Alberta, Edmonton AB T6G 2G8, Canada. Email: jpcarey{at}ualberta.ca
Abstract
Braces are used by orthodontists to correct the misalignment of teeth in the mouth. Archwire rotation is a particular procedure used to correct tooth inclination. Wire rotation can result in deformation to the orthodontic brackets, and an orthodontic torque simulator has been designed to examine this wire–bracket interaction. An optical technique has been employed to measure the deformation due to size and geometric constraints of the orthodontic brackets. Images of orthodontic brackets are collected using a stereo microscope and two charge-coupled device cameras, and deformation of orthodontic brackets is measured using a three-dimensional digital image correlation technique. The three-dimensional deformation of orthodontic brackets will be evaluated. The repeatability of the three-dimensional digital image correlation measurement method was evaluated by performing 30 archwire rotation tests using the same bracket and archwire. Finally, five Damon 3MX and five In-Ovation R self-ligating brackets will be compared using this technique to demonstrate the effect of archwire rotation on bracket design.
Introduction
Orthodontic braces, which consist of a series of brackets bonded to the teeth and load applying wire, are used to correct teeth misalignment (malocclusions) within the dental arch.1 Tooth movement is achieved by rotating the rectangular archwire within the rectangular bracket slot, and the amount of force applied to a tooth is controlled by the engagement of the archwire with the bracket slot.2
Archwire rotation and slot engagement can result in both elastic and plastic deformations to the orthodontic bracket altering bracket response to subsequent archwire rotations.2,3 The small size, complicated geometry, and complex loading conditions of orthodontic brackets make most conventional measurement methods used to assess deformation impractical. An orthodontic torque simulator (OTS) was designed and developed to measure the effect of archwire rotation on orthodontic brackets by measuring the forces and moments applied to a bracket using a six-axis load cell.4 The capability of this device was extended by adding a charge-coupled device (CCD) camera and stepper motor and utilizing a full-field digital image correlation (DIC) method to measure bracket deformation as a function of archwire rotation.5 Subsequently, the OTS was used to measure deformation of a variety of conventional and self-ligated brackets.6⇓–8
Prior to the development of the OTS, several studies examined the effect of archwire on bracket deformation.9⇓⇓⇓–13 These studies were limited to measuring permanent deformation since the brackets were only evaluated pre and post archwire rotation. For example, the study by Kapur et al.11 measured the permanent change in titanium and stainless steel bracket slot profile before and after archwire rotation using a stereo microscope to quantify bracket deformation. This study only measured permanent change to the bracket slot, and an assessment of the measurement resolution was not given. Similarly, Feldner et al.13 measured bracket deformation at a variety of archwire rotation angles. Bracket deformation was measured visually using a stereo microscope and a protractor. The studies by Kapur et al.11 and Feldner et al.13 were unable to determine the wire torque at which the onset of permanent deformation occurs and were unable to specifically show the specific ranges of elastic and plastic deformations, thus failing to provide the clinically critical limit at which onset of plastic deformation occurs. Understanding the relationship between the applied loads and resulting deformations to orthodontic brackets is important to improve treatment efficiency and to generate accurate bracket–archwire–tooth interaction models for treatment optimization.
Deformation measurements using a single camera5⇓⇓–8 can only measure surface in-plane motion of the bracket; out-of-plane motion and deformation measurements require a minimum of two cameras.14 The ability to measure three-dimensional (3D) deformation of the orthodontic bracket will enable the interaction of the archwire–bracket to be fully described using three-dimensional digital image correlation (3D DIC). This article will resolve the level of 3D deformation of orthodontic brackets and will illustrate the additional level of detail that can be acquired using the 3D DIC approach for completely understanding orthodontic bracket deformation.
Mechanics of orthodontic brackets
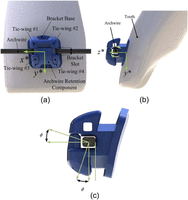
Braces and archwires are used by orthodontists to correct teeth misalignment (malocclusions) within the dental arch.1 The archwire is retained in the bracket slot using conventional ligation means, such as elastic bands or stainless steel ligature wires, or with self-ligating brackets, which include a movable component to secure the archwire.15,16 The movable component used to secure the archwire is referred to as a spring clip or slide depending on the bracket design17,18 but for the remainder of this discussion, the movable component will be referred to as the archwire retentive component (ARC). An example of a self-ligating bracket is shown in Figure 1. It can be seen in Figure 1(a) and (b) that for a coordinate system attached to the bracket (x*, y*, z*), the x*-axis is defined as parallel to the archwire, the y*-axis is defined as the direction of lateral motion of the bracket tie-wings due to archwire rotation, and the z*-axis defines the direction from the base of the orthodontic bracket to the top of the bracket tie-wings. Archwire rotation occurs about the x*-axis, and the angle of archwire rotation is defined as φ. The angle of archwire rotation, φ, is shown in Figure 1(c). The neutral position of the archwire is defined as that position when the archwire is parallel to the base of the bracket slot, as shown in Figure 1(c).
Self-ligating orthodontic bracket components: (a) top view of bracket showing tie-wings, archwire, and bracket base; (b) side view of bracket showing the angle of the bracket slot (prescription) and archwire rotation occurs about the x*-axis of the bracket coordinate system; and (c) archwire rotation, φ.
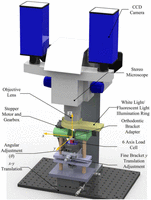
Methods
Description of the OTS
The OTS, initially developed for two-dimensional (2D) measurements, was expanded from a single to a stereo camera configuration, as shown in Figure 2. As described in the studies by Badawi et al.,4 Lacoursiere et al.,5 and Major et al.,6,7 the OTS was designed to simulate clinical archwire rotation, and it measures bracket forces and moments. The addition of a second camera and stereo microscope, as shown in Figure 2, allows for 3D DIC bracket tie-wing deformation measurements. The OTS is positioned in the camera and microscope field of view using three translation stages (LT01 Translation Stage, Thor Labs, Newton, NJ, USA). The height (z) of the microscope above the OTS is adjusted to focus on the top surface of the bracket. The OTS in-plane positions (x, y) are also adjusted using these translation stages to center the bracket in the microscope field of view.
Orthodontic torque simulator used to replicate the effect of archwire rotation on orthodontic brackets stereo camera version.
CCD: charge-coupled device.
Archwire rotation is achieved using an automated stepper motor and gear box. The OTS is controlled using custom software (LabWindows/CVI, National Instruments, Austin, TX, USA). The program automates the control of the stepper motor, acquisition of data from the load cell, and image acquisition. A six-axis load cell (Nano17 SI-25-0.25, ATI Industrial Automation, Apex, NC, USA) is used to collect applied force and moment data. The complete details of the OTS design are described in the studies by Badawi et al.,4 Lacoursiere et al.,5 and Major et al.7
Stereo microscope and CCD cameras
The addition of a stereo microscope allows for the in- and out-of-plane (x*, y*, z*) motions of the orthodontic bracket to be measured. This OTS configuration shown in Figure 2 comprises a stereo microscope (Zeiss SteREO Discovery v8 microscope, Carl Zeiss MicroImaging GmbH, Göttingen, Germany) with a 60-mm working distance objective lens (1.0X Zeiss V8 Plan Apo Objective Lens, Carl Zeiss MicroImaging GmbH). Images were collected using two CCD cameras (Imager Intense, LaVision GmbH, Göttingen, Germany) having a 1376 × 1040 pixel array and 12-bit resolution. The brackets were imaged at 2.0× magnification to maximize the bracket in the camera field of view. Test specimens were illuminated using a ring light (2.64″ Ring Light, Variable Frequency, Edmund Optics, Barrington, NJ, USA) and a 365 nm black light (Black (365 nm Peak) Replacement Bulb, Edmund Optics) to provide even illumination across the field of view.
DIC
DIC is a full-field optical measurement technique that uses a random speckle pattern on a specimen surface to measure deformations and strains.14,19 Deformation is measured by tracking contrast features on the specimen surface between subsequent images. DIC displacement measurement comprises four consecutive steps: (1) specimen preparation, (2) calibration of the imaging system for a defined field of view, (3) collection of specimen deformation before and after loading, and (4) post processing of images to determine displacement or strain.20 A specimen is prepared by applying a random pattern to the object surface using natural surface features or paints. Images are calibrated to convert from pixels to physical space (e.g. millimeter and inches) by acquiring an image of a target with a grid of known spacing. Each digital image is segmented into evenly spaced subsets of size (2M + 1) × (2M + 1), and an image correlation algorithm is performed for each image subset. The displacement of a subset is determined by maximizing a typical cross-correlation coefficient equation, S, as shown in equation (1) for the image before and after deformation20,21
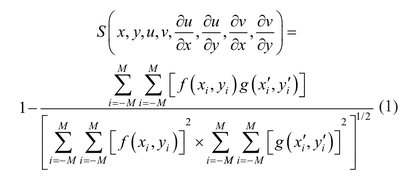
where f (xi, yi) represents the gray-scale intensity at positions (xi, yi) for the reference image, and g(x′i, y′j) represents the gray-scale intensity at positions (x′i, y′i) of the deformed image.
A schematic of the 3D DIC processing method is shown in Figure 3. Figure 3 shows that cross-correlation is performed between images 1 and 2 for cameras A and B to determine the 2D displacement vectors (u1, v1) and (u2, v2). The surface height of the test object is determined through stereo cross-correlation between cameras A and B for each image pair. The 3D displacement vectors (u, v, w) are determined using the 2D displacement vectors for each camera and the determined surface height from the stereo cross-correlation of the test object.22⇓–24
Sample preparation
Orthodontic brackets were prepared prior to testing by coating the surface of the bracket with green fluorescent airbrush paint (5404 Fluorescent Green Createx Airbrush Colors, Createx Colors, East Granby, CT, USA). The paint was reduced to improve the flow of the paint through an airbrush (Wicked W100 Reducer Createx Airbrush Colors, Createx Colors). Fluorescent paint was chosen to reduce specular reflection from the metallic bracket surfaces. The fluorescent paint produces a distinct pattern on the test object surface, and the intensity of the speckle pattern remains constant as the test object deforms. Fluorescent paint is advantageous for this particular application since the fluorescent particles act as a light source rather than reflecting light. The speckle pattern was applied using a high-quality airbrush (Custom Micron B, Iwata Medea Inc., Portland, OR, USA). A similar method for speckling samples on a microscale was outlined by Berfield et al.25 The author demonstrated that an airbrush can be used to produce an adequate speckle pattern for image resolutions that range between 3 and 10 µm/pixel using a stereo microscope.
Stereo camera calibration
Calibration of the stereo cameras is performed to orient the cameras in 3D space. The stereo calibration process is essential to acquiring accurate 3D measurements.19,21,23,26 The calibration procedure determines the 3D position of each camera relative to the world coordinate system. The camera calibration procedure is described in the study by Luo et al.27
Calibration for the stereo microscope camera setup was carried out using a glass calibration target (Microscope Calibration Plate 0.25–1 mm dot spacing, LaVision GmbH) that has a known regular grid on the surface. The 0.50 mm grid with 0.12-mm-diameter marks was used for the calibration of the stereo microscope. The calibration plate was displaced in known increments of 25.4 µm in the z* direction using a micrometer-driven stage (MT01 Translation Stage, Thor Labs), and stereo images of the calibration target were acquired at three locations in the z* direction.
Image post processing
Images collected using the OTS were acquired and post processed using a commercial software package (LaVision GmbH DaVis 8.06, 2009). Image subsets, or window size, used to determine the 3D displacement of the brackets were 64 × 64 pixels as a compromise between vector precision and maximization of the number of interrogation windows for each tie-wing. The field of view for the brackets was 1376 × 1040 pixels or 4.25 × 3.2 mm.
Measurement of 3D bracket deformation
To demonstrate the 3D displacement of orthodontic brackets, a Damon 3MX (Ormco Corporation, Orange, CA, USA) bracket was tested. The Damon 3MX bracket was selected as it is a typical self-ligating bracket. The design of the Damon 3MX bracket is such that a significant difference in the height of the four bracket tie-wings does not exist; therefore, the four bracket tie-wings should not move out of the stereo microscope’s depth of focus. Other self-ligating bracket designs demonstrate a substantial difference in the height of the bracket tie-wings, which may affect the ability to maintain focus on all four bracket tie-wings.
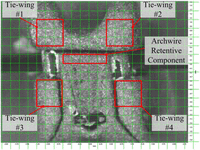
Deformation of the bracket was assessed by determining the relative motion between the four bracket tie-wings, as described in Figure 4. Figure 4 also shows the 64 × 64 pixel subset used for the measurement of the 3D displacement of the bracket. Equation (2) details the calculation of the bracket displacement in the x*, y*, and z* directions

where  denotes the average displacement of the defined regions for tie-wings 1, 2, 3, and 4 for the i = x*, y*, z* directions; LHSD is the displacement between tie-wings 1 and 3; and RHSD is the displacement between tie-wings 2 and 4.
In addition, the motion of the bracket ARC in the i = x*, y*, z* directions was measured. Bulk motion of the entire bracket was eliminated to find the relative motion of the bracket-retentive component by subtracting the average displacement of the tie-wings from the motion of the bracket-retentive component. The relative retentive component motion is denoted as RelativeRCi and the retentive component motion is denoted as RCi, as shown in the following equation

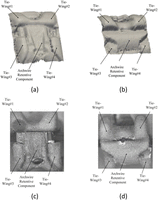
For example, 3D bracket surfaces created from the 3D DIC displacement vector coordinates are shown in Figure 5(a) and (b) for the Damon 3MX and In-Ovation R brackets, respectively. Figure 5 shows that stereo image pairs can be used to generate a 3D surface that can be visualized using a 3D rendering software (ParaView, Kitware, Inc., Clifton Park, NY, USA). The original bracket images for the Damon 3MX and In-Ovation R brackets are also shown in Figure 5(c) and (d) for comparison. Figure 5 shows that the general 3D surface features of the orthodontic brackets can be recreated from the stereo image pairs collected using the OTS.
3D bracket surface created from stereo image pairs (a) Damon 3MX and (b) In-Ovation R; and (c) Damon 3MX bracket image (d) In-Ovation R bracket image (3D: three-dimensional).
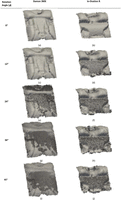
A sequence of bracket surfaces and displacement vectors is shown in Figure 6 (Figure 6(a), (c), (e), (g), and (i): Damon 3MX; Figure 6(b), (d), (f), (h), and (j): In-Ovation R). The motion of the bracket in the x*, y*, and z* directions is represented by 3D displacement vectors. Figure 6 shows the displacement vectors increasing with increasing archwire rotation up to 45° of the two brackets side by side. The majority of the relative motion is localized to the archwire retention component and the tie-wings that the archwire loads at the top of the image.
3D bracket surface and 3D displacement vectors for Damon 3MX and In-Ovation R brackets: (a) Damon 0° rotation, (b) In-Ovation 0° rotation, (c) Damon 12°, (d) In-Ovation 12°, (e) Damon 24°, (f) In-Ovation 24°, (g) Damon 36°, (h) In-Ovation 36°, (i) Damon 45°, and (j) In-Ovation 45°.
3D: three-dimensional.
Repeatability of 3D bracket measurements
The repeatability of the 3D bracket deformation measurement method and OTS was assessed by performing multiple archwire rotation tests using the same bracket and archwire. A Damon 3MX (Ormco Corporation) bracket with a common prescription of 12° torque, 5° angulation, and 0° rotation for the upper right incisor 29 was used to test OTS repeatability. A 0.4826 × 0.635 mm archwire was used for this study. Using the automated OTS software, the angle of the archwire, φ, was rotated in 2° increments to a maximum angle of 20°. Once the maximum angle was reached, the archwire was returned to the original position in 2° increments. At each increment, a pair of stereo images of the orthodontic bracket was collected resulting in 22 image pairs collected. A 1-s delay was used between each archwire rotation increment. The maximum archwire rotation of 20° was used to ensure that plastic deformation does not occur to the bracket tie-wings.
Deformation characteristics of two orthodontic brackets
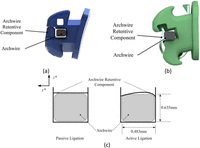
Two orthodontic brackets were compared to assess the difference in 3D deformation due to archwire rotation. A 0.483 × 0.635-mm cross-section stainless steel archwire was used. A total of 10 brackets were tested: five Damon 3MX (Ormco Corporation) and five In-Ovation R (GAC, Bohemia, NY, USA) brackets. Two upper right incisor (U1R) brackets with a nominal slot width of 0.5588 mm and the same prescription were selected. The In-Ovation R brackets have active-ligation, whereas the Damon 3MX brackets have passive-ligation brackets. The ARC for the active-ligation brackets maintains contact between the archwire and ARC and applies a force in the z* direction to the archwire. Conversely, the passive-ligation brackets only apply a force to the archwire when the archwire contacts the ARC. An illustration of the difference between active and passive bracket ligation is shown in Figure 7.
Comparison of self-ligating brackets: (a) passive-ligation Damon Q (solid model provided by Ormco), (b) In-Ovation R (solid model provided by GAC) active ligation applies a preload to the wire, and (c) schematic of passive- and active-ligation brackets.
Using the automated OTS software, the angle of the archwire, φ, was rotated in 3° increments to a maximum angle of 45°. Once the maximum angle was reached, the archwire was returned to the original position in 3° increments. At each increment, a pair of stereo images of the orthodontic bracket was collected resulting in 32 image pairs collected. The stereo image sequence was used to measure the 3D deformation of the bracket due to archwire rotation by post processing the images using the previously described method.
A Mann–Whitney U nonparametric test (ranksum function, Statistics Toolbox, MATLAB, 2009a, The MathWorks, Natick, MA, USA) was used to determine whether a statistically significant difference can be found between the Damon 3MX and In-Ovation R brackets. The test was selected due to the small sample size for each bracket. A P-value of less than 0.05 indicates that a statistical difference exists between the two brackets.
Results and discussion
Repeatability of 3D bracket measurements
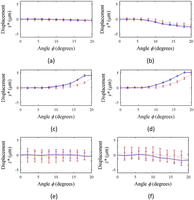
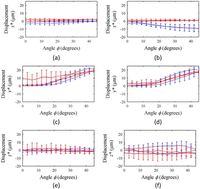
The repeatability of the 3D bracket deformation measurement method and OTS was assessed by performing multiple archwire rotation tests on the same bracket. A total of 30 archwire rotation tests were performed using the same Damon 3MX orthodontic bracket and archwire. The average and standard deviation tie-wing motion for the x*, y*, and z* directions at every rotation angle determined using equation (3) are summarized in Figure 8.
Repeatability of Damon 3MX bracket tie-wing motion. Average and standard deviation displacements for (a) tie-wing 1–3 x*, (b) tie-wing 2–4 x*, (c) tie-wing 1–3 y*, (d) tie-wing 2–4 y*, (e) tie-wing 1–3 z*, and (f) tie-wing 2–4 z*.
Solid line indicates increasing archwire rotation. Dashed line indicates decreasing archwire rotation.
The maximum tie-wing displacement and standard deviations are summarized in Table 1. The maximum displacement in the y* direction is 4.2 ± 0.29 and 5.2 ± 0.26 µm for tie-wings 1–3 and 2–4, respectively. In addition, the final deformation, as shown in Figure 8(c) and (d), in the y* direction is −0.07 ± 0.31 and −0.008 ± 0.30 µm for tie-wings 1–3 and 2–4, respectively, indicating that the bracket tie-wings did not plastically deform in the y* direction due to repeated archwire rotation. Figure 8 shows that the greatest motion for the bracket tie-wings occurred in the y* direction. The maximum magnitude of motion in the y* direction was 10.7 and 3.0 times greater than the maximum z* motion for tie-wings 1–3 and 2–4, respectively. Similarly, the maximum magnitude of motion in the y* direction was 12.0 and 2.0 times greater than the x* motion for tie-wings 1–3 and 2–4, respectively, indicating that the dominant motion of the Damon 3MX bracket tie-wings is the y* direction. The range bars in Figure 8 show the variation of the test bracket for 30 archwire rotation tests. Figure 8 shows that the largest range bars occur in the z* direction, while the x* and y* directions exhibit similar range bars. The large range bars in the z* direction may indicate motion of the entire bracket in this direction rather than tie-wing deformation.
Maximum tie-wing motion.
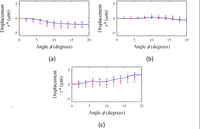
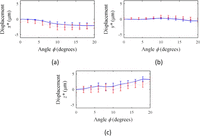
The average motion and standard deviation of the bracket retentive component at each angle as determined using equation (3) are shown in Figure 9. The maximum ARC motion is summarized in Table 2. Table 2 shows that the greatest motion for the ARC was observed in the z* direction since maximum magnitude of motion in the z* direction was 1.5 and 6.2 times greater than the x* and y* motions.
Repeatability of Damon 3MX bracket ARC. Average and standard deviation of archwire retentive displacements: (a) component x*, (b) ARC y*, and (c) ARC z*.
ARC: archwire retentive component.
Solid line indicates increasing archwire rotation. Dashed line indicates decreasing archwire rotation.
Maximum ARC motion.
Figure 8 shows that the dominant motion for the bracket tie-wings is in the y* direction, while Figure 9 shows that the dominant ARC motion is in the z* direction. The maximum variation for the tie-wings and ARC displacement is summarized in Tables 1 and 2. From Tables 1 and 2, it can be seen that the variation between each bracket test is much greater than the 0.07 µm resolution of the 3D DIC method. As a result, the variation seen in the bracket tie-wing and ARC motion can be attributed to variation due to the wire–bracket interaction. Table 1 shows that the variation in the x* and y* motions was in the region of 0.3 µm, while the variation in the z* direction was 1.5 µm. In addition, Table 2 shows that the variation of the ARC was in the region of 0.7 µm.
Deformation characteristics of two orthodontic brackets
Deformation characteristics of two orthodontic brackets were compared to assess the differences in bracket deformation and observe first-hand 3D general behavior due to archwire rotation. The geometric differences between the self-ligating Damon 3MX (passive) and In-Ovation R (active) brackets can be seen in Figure 7. The two brackets were examined to demonstrate the results produced by the OTS and to show how brackets of different design can be compared using this device.
Comparison of the resulting tie-wing motion of the Damon 3MX and In-Ovation R brackets is shown in Figure 10, and the motion of the ARC of the two brackets is compared in Figure 11. The maximum tie-wing motion for the Damon 3MX and In-Ovation R brackets and final plastic deformation are shown in Table 3. Both the Damon 3MX and In-Ovation R brackets exhibited similar deformation in the y* direction for a maximum archwire rotation of 45°. Table 3 shows that a significant difference can be seen in the x* direction for the tie-wings 1–3 and 2–4.
Damon 3MX and In-Ovation R bracket tie-wing average motion and standard deviation as a function of wire rotation angle: (a) tie-wing 1–3 x*, (b) tie-wing 2–4 x*, (c) tie-wing 1–3 y*, (d) tie-wing 2–4 y*, (e) tie-wing 1–3 z*, and (f) tie-wing 2–4 z*.
Solid line indicates In-Ovation R bracket. Dashed line indicates Damon 3MX bracket.
Bracket ARC motion: (a) ARC x*, (b) ARC y*, and (c) ARC z*.
Solid line indicates In-Ovation R bracket. Dashed line indicates Damon 3MX bracket.
Maximum and plastic deformation due to archwire rotation for Damon 3MX and In-Ovation R brackets.
The calculated P-values using the Mann–Whitney U nonparametric test for comparing the tie-wing motion of the two brackets at every angle are summarized in Table 4. From Table 4, it can be seen that a statistically signification difference exists between the two brackets in the x* direction for an archwire rotation greater than 9°. A statistically significant difference was detected for increasing archwire rotation between 33° and 39° in the y* motion for both the left and right tie-wings. No differences were detected between the z* motion of the two brackets.
Comparison of orthodontic bracket tie-wing motion.
Bracket design may affect the bracket response to archwire rotation. This is demonstrated by the x* motion of the two brackets, as shown in Figure 10(a) and (b). The greater motion in the x* direction shown by the Damon 3MX bracket could be the result of a taper in the bracket slot due to manufacturing resulting in uneven load transfer from the archwire. In addition, the In-Ovation R bracket demonstrated positive motion in the x* direction, while the Damon 3MX bracket moved in the negative x* direction. The difference in the taper of the two bracket slots will affect the tendency of the bracket to rotate due to archwire rotation. The difference between the brackets could also be due to the ligation method. The active-ligation In-Ovation R brackets could ensure that the archwire remains aligned in the bracket slot, whereas the archwire is free to move in the bracket slot of the passive-ligation Damon 3MX bracket.
The calculated P-values for the ARC of the two brackets are summarized in Table 5. The In-Ovation R brackets demonstrated a sharp change in the y* and z* displacement of the ARC at 6° of archwire rotation, as shown in Figure 11(b) and (c). The change in the ARC is due to the interaction between the archwire and the retentive component. By contrast, a distinct change in the retentive component was not observed for the Damon 3MX bracket. The difference in the ARC behavior is related to the design of the brackets, as shown in Figure 7. Damon 3MX is a passive-ligation bracket, while the In-Ovation R is an active-ligation bracket. The sharp change in the In-Ovation R brackets occurs when the bevel of the archwire is no longer in contact with the ARC causing a sudden change in the y* and z* motion of the retentive component.18 Table 5 shows that a significant difference exists for the motion of the ARC in the y* and z* directions for archwire rotation between 3° and 15°, indicating that the initial ARC motion is affected by the design of the test bracket. The difference in the behavior of the two brackets is due to the compliance of the ARC, as discussed in the study by Pandis et al.28 The In-Ovation R brackets have a more elastic retentive component, while the Damon 3MX retentive component is more rigid.
Comparison of orthodontic bracket ARC motion.
Prior measurements of tie-wing displacement have been limited to measuring bracket deformation in the x* and y* directions.5⇓⇓–8 The addition of a second camera to the OTS allows for the measurement of the z* displacement. Deformation of the orthodontic bracket was measured by post processing a sequence of stereo images collected using the OTS. Post processing of the image sequence was performed using the aforementioned 3D DIC method.
The lateral motion of the bracket tie-wings in the y* direction and motion of the ARC in the z* direction are the dominant displacement vector directions. The image sequence in Figure 6 shows the difference in displacement vectors between the Damon 3MX and In-Ovation R brackets. It can be seen that the In-Ovation R bracket ARC exhibits greater displacement than the tie-wings. The In-Ovation R bracket ARC indicates motion at 12° archwire rotation, while the Damon bracket does not exhibit such motion at this wire angle. The difference in motion of the ARC is due to the difference in bracket design, as shown in Figure 7. The difference between the design of the In-Ovation R and Damon 3MX brackets has been noted in the study by Pandis et al.,28 and the author notes that the In-Ovation R bracket has an ARC that is more compliant than the Damon 3MX bracket design; therefore, it is expected that greater motion of the In-Ovation R retentive component should occur. The design of active-ligation orthodontic brackets could be modified to include a less compliant ARC. A stiffer ARC could result in less force lost due to the motion of the ARC and more force transmitted to the bracket to cause tooth motion.
Permanent deformation due to archwire rotation can result in increased treatment time. A large torque applied to the archwire can result in permanent deformation to the bracket tie-wings.5,6,12 If permanent deformation occurs, the orthodontic brackets will cease to function as expected, and consequently, treatment time will be affected since brackets are typically not replaced each time the archwire is engaged in the bracket slot. Permanent deformation could be prevented by selecting less stiff archwires or smaller archwires rather than the 0.019 × 0.025″ archwires that were used in this study.
Conclusion
A novel method for measuring the 3D deformation of orthodontic brackets has been developed using a contact-free 3D DIC technique. Using this method, it is possible to achieve 3D bracket deformation. This technique also shows the interaction between the archwire and the ARC. The repeatability of the OTS was evaluated and compared to the resolution of the 3D DIC method. Two self-ligating brackets were compared using the 3D DIC method; the method highlighted clear differences in the behavior of active and passive-ligation brackets. This study shows that engagement of the archwire in the bracket retentive component could affect treatment effectiveness since the archwire rotation applies a force to the retentive component instead of the expected force to the tie-wings leading to inefficient force couple transfer. Accurate measurement of the deformation of orthodontic brackets may reduce patient treatment times and improve the overall success of an orthodontic operation by providing a helpful guide for orthodontists to select an appropriate amount of archwire adjustment for each treatment and lead to improved designs.
Article Notes
-
Declaration of conflicting interests The authors declare that there is no conflict of interest.
-
Funding This research was funded by the University of Alberta Research project RES0003931 and the Dr Reyburn McIntyre fund.
- © The Author(s) 2013

