


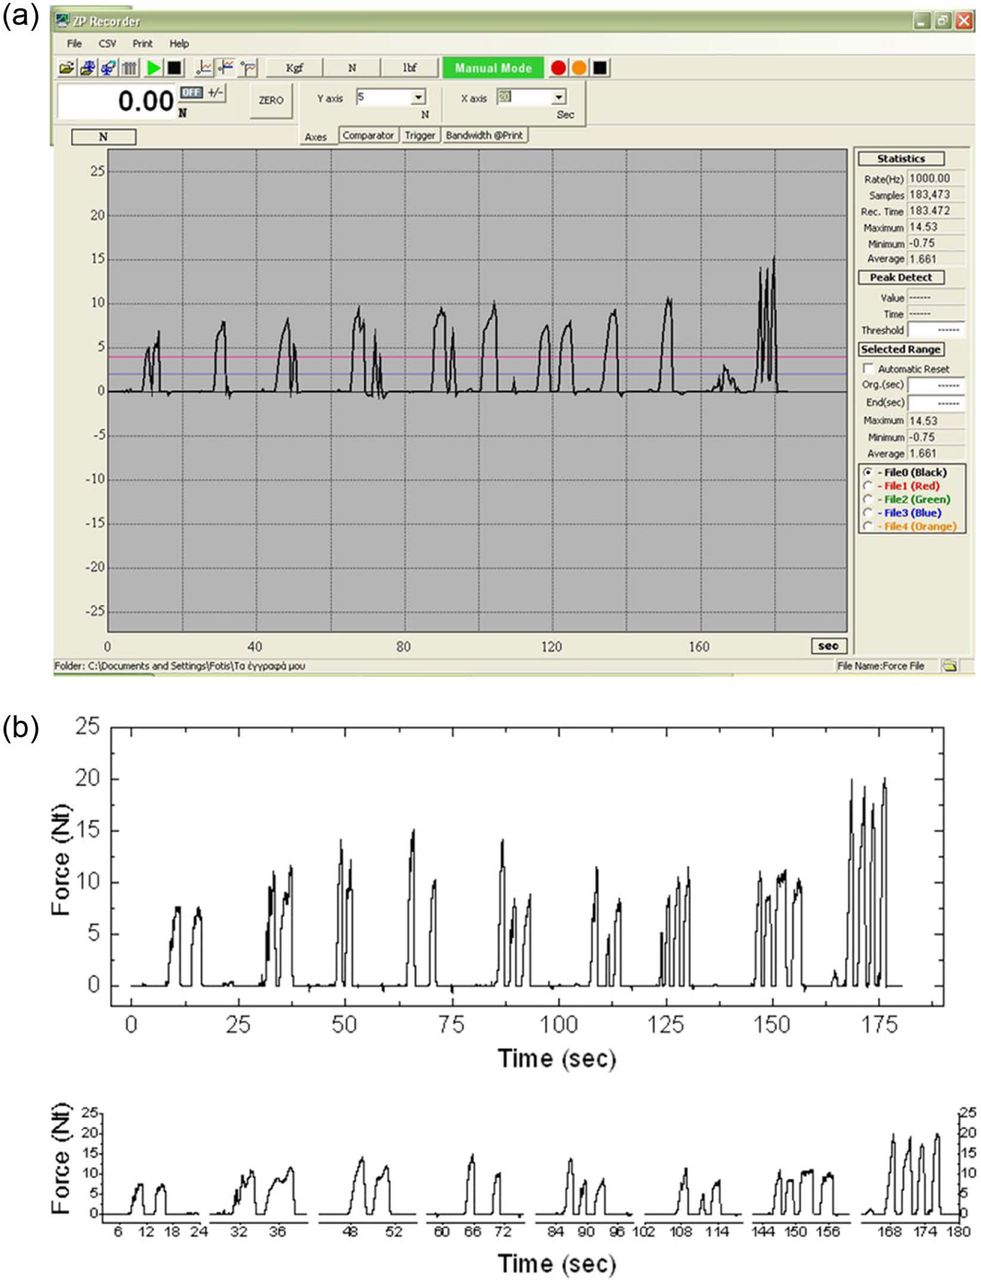
Figure 4.
Two graphs recorded during the obturation of two root canals with the use of EGK: (a) The computer’s screen icon during the device’s operation during a root canal obturation. (b) A diagram generated after a root canal obturation (the lateral condensation’s seven circles and the vertical compaction’s last phase are highlighted).
EGK: Ekontak et al Gauge K-Device.