


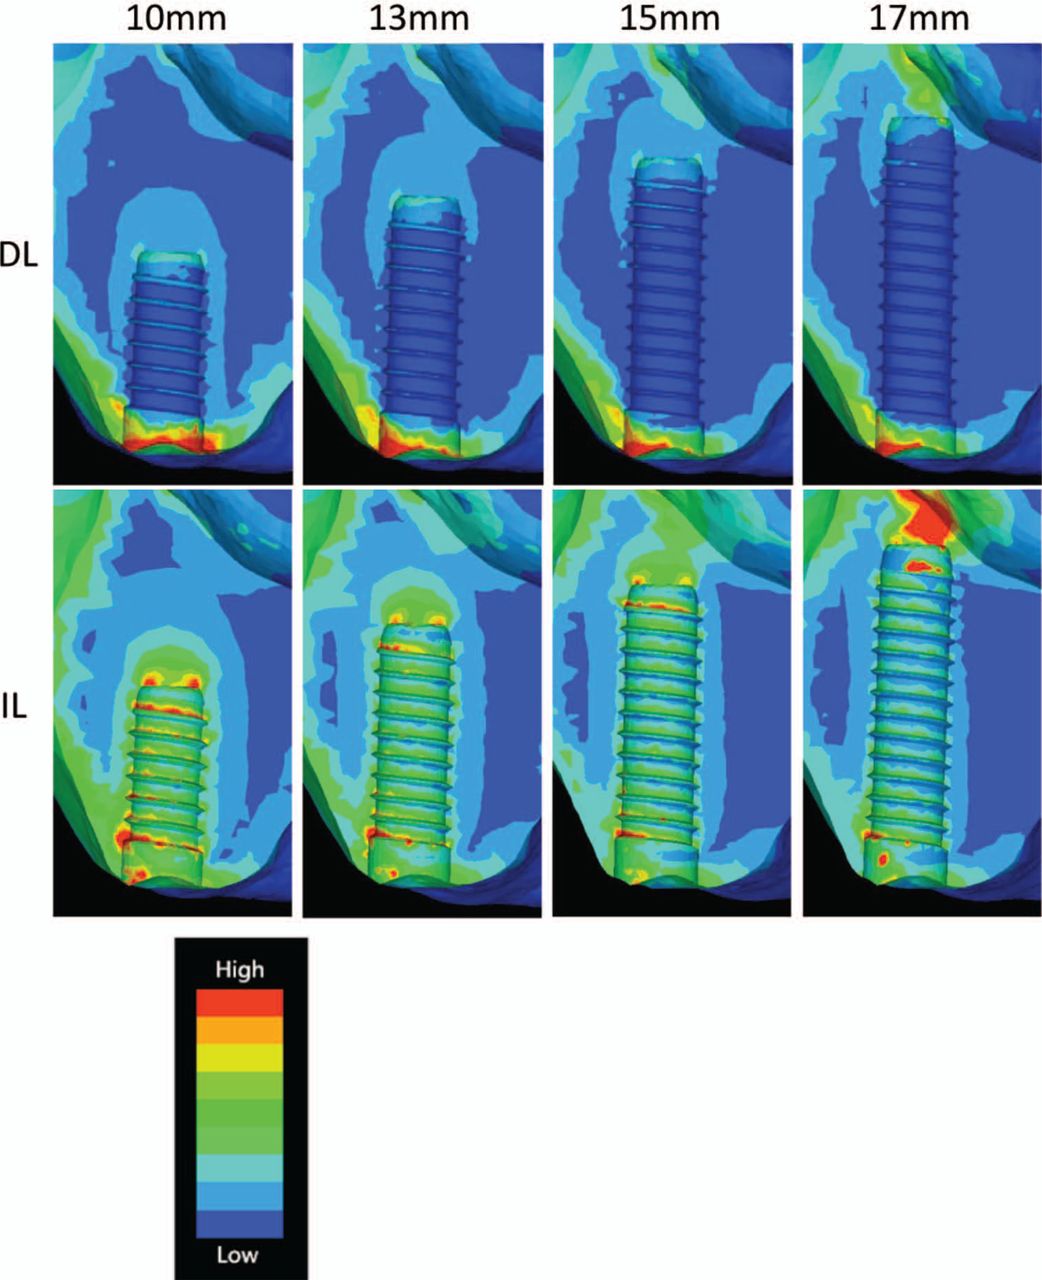
Figure 2.
Comparison of stress distribution in loaded implants of various lengths. Upper panels show implants given time to fully osseointegrate (delayed loading). Lower panels show implants loaded immediately after placement (immediate loading).


