


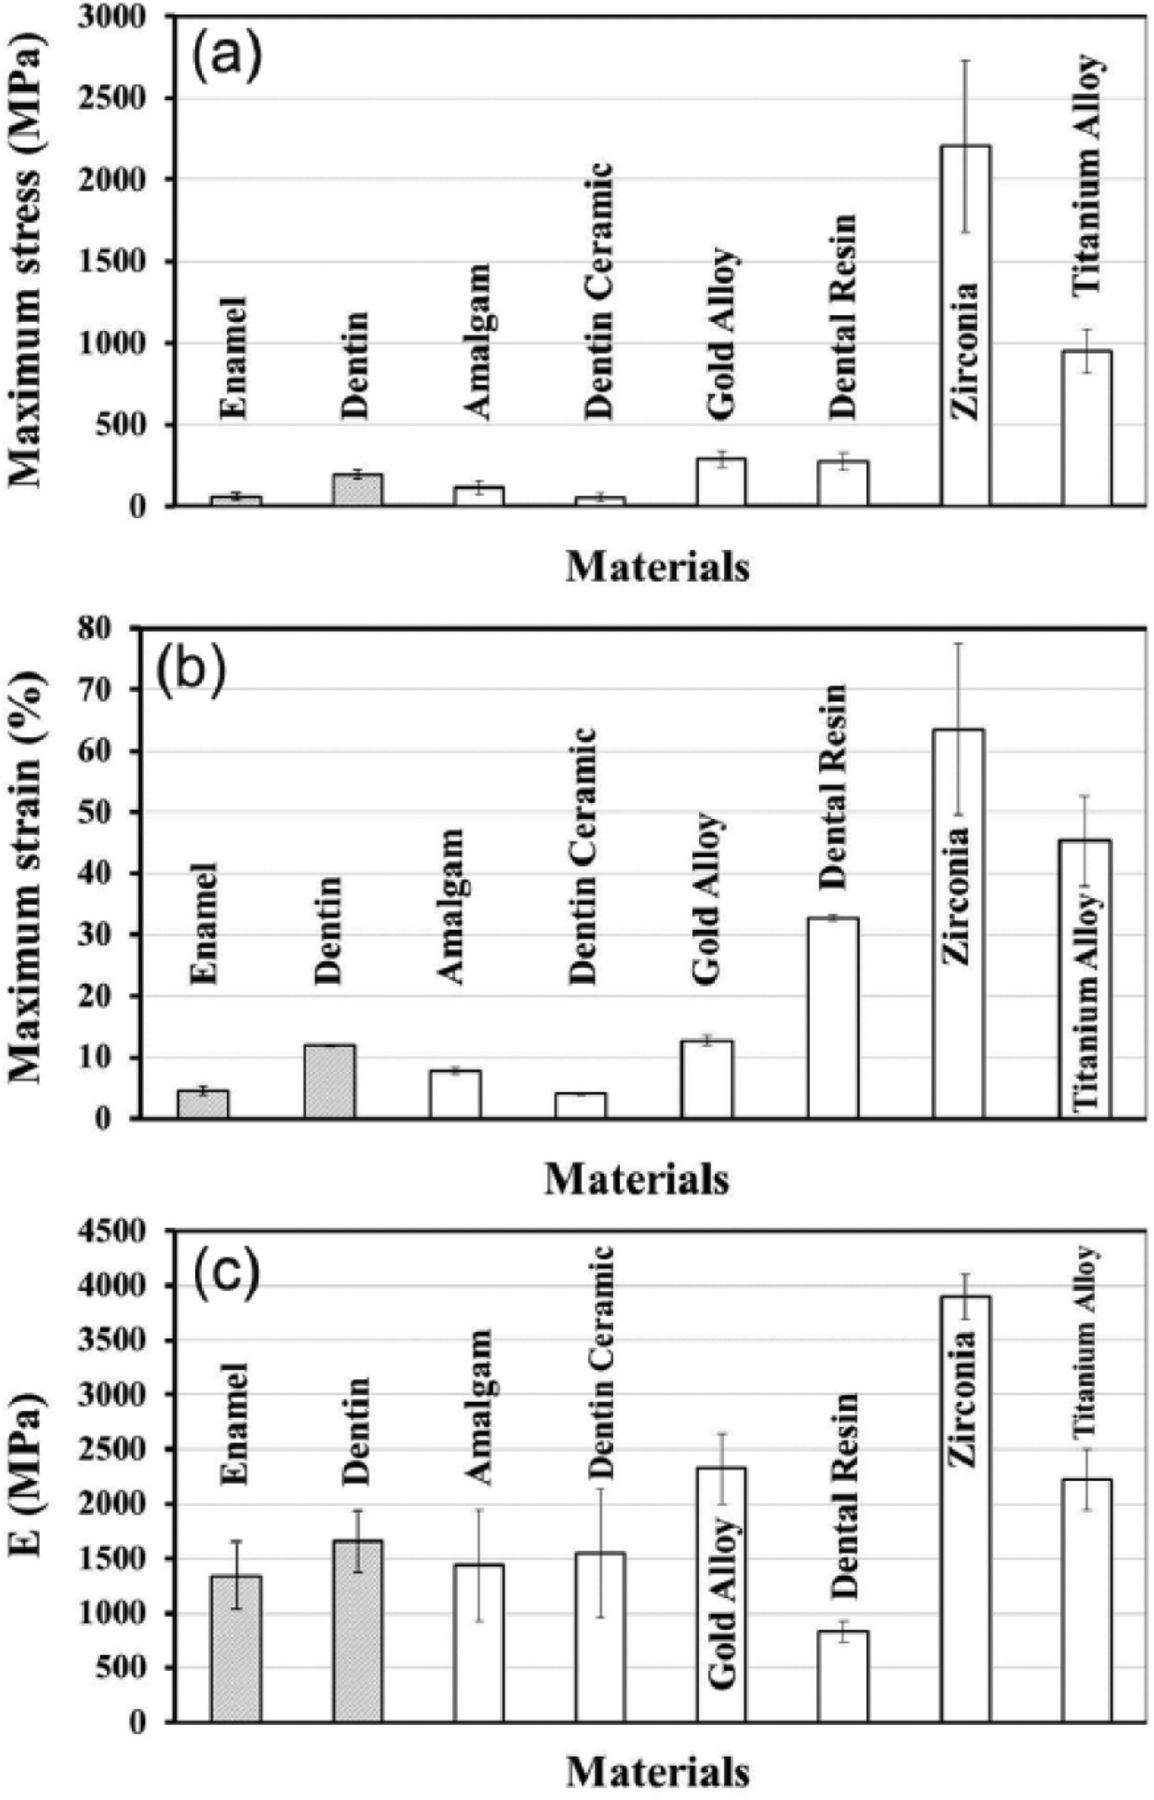
Figure 3.
Comparison of (a) maximum stress (MPa), (b) maximum strain (%), and (c) elastic modulus (MPa) of each material from compression tests.
(Downloading may take up to 30 seconds. If the slide opens in your browser, select File -> Save As to save it.)
Click on image to view larger version.
Comparison of (a) maximum stress (MPa), (b) maximum strain (%), and (c) elastic modulus (MPa) of each material from compression tests.
 CiteULike
 Connotea
 Delicious
 Digg
Digg Facebook
 Google+
 LinkedIn
 Mendeley
 Reddit
 StumbleUpon
 Twitter

