


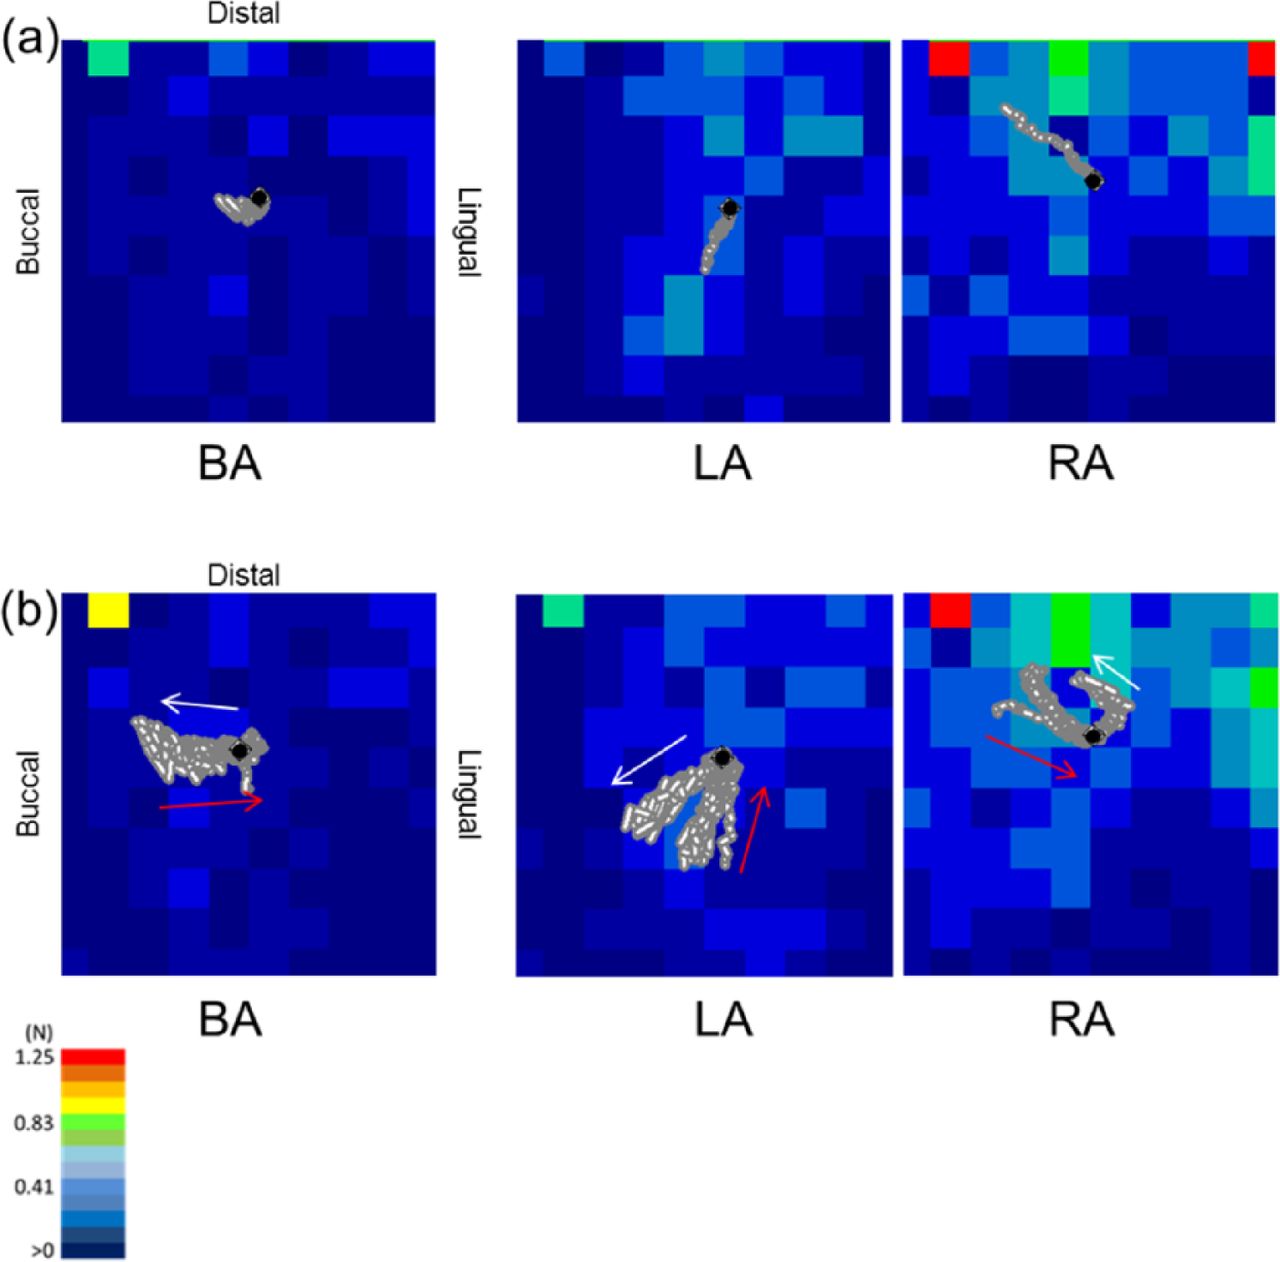
Figure 11.
Distribution of load on the residual ridge beneath the denture: (a) during the static 100 N of load being applied (n = 5) and (b) during the dynamic 100 N of load being applied (n = 5).
Black point: load center when the maximum load was exerted.
Gray dot: a shifting pattern of load center.
Red arrow: load applying phase.
White arrow: load disengaging phase.


