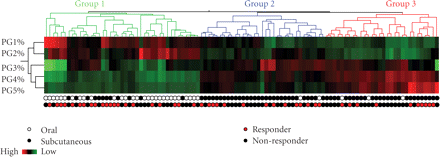
Hierarchical clustering of the proportions of individual MTX polyglutamate subtype (PG1−5%) ordered by total intracellular MTX concentrations ( ) in 104 individual patients with JIA. Red denotes high concentrations, and green denotes low concentrations. Proportions
of short chain MTXglu1 + 2 (PG1% and PG2%) cluster together and proportions of long chain MTXglu3−5 (PG3%, PG4%, PG5%) cluster together as subgroups. Each column represents an individual patient who has received MTX subcutaneously
(black circles), or orally (white circles) and has active arthritis (black circles), or inactive arthritis (red circles) at
the time of the blood draw.


