- Institution: Stanford Univ Med Ctr Lane Med Lib/Periodical Dept/Rm L109
- Sign In as Member / Individual
Expression Array Technology in the Diagnosis and Treatment of Breast Cancer
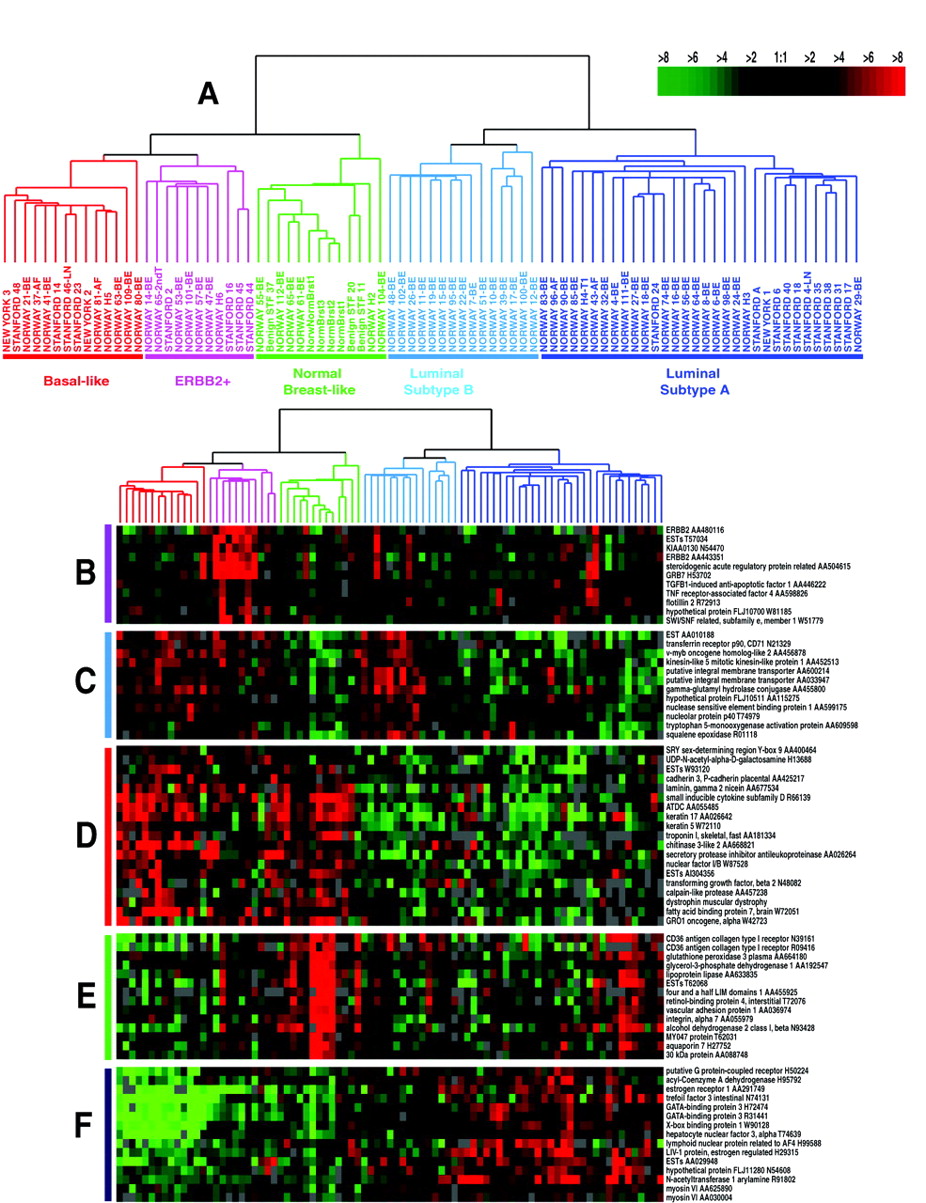
Gene expression patterns of eighty-five breast samples. Seventy-eight carcinomas, three benign tumors, and four normal breast tissues cluster into five subtypes: Luminal A [estrogen-receptor (ER) positive, favorable survival]; Luminal B (ER positive, poor survival); Normal breast-like; ERBB2 amplicon; Basal epithelial-like cluster.
(A) Tumor clusters are represented by branched dendrograms (upper figure) that indicate degree of similarity between samples. Genes are clustered by rows according to similarity of expression. Red indicates high gene expression relative to reference; green indicates more expression in reference RNA than in tumor sample (low relative expression). Representataive gene clusters expressed by the five tumor subtypes above are shown: (B) the ERBB2 amplicon cluster; (C) genes coexpressed by the Luminal B tumors and the basal and ERBB2 tumors; (D) basal epithelial cluster containing keratins 5 and 17; (E) normal breast-like cluster; and (F) Luminal A cluster containing ER-associated genes with lower relative expression of these genes by the Luminal B tumors. [From Sorlie et al., PNAS 98: 10869–10874. Copyright (2001) National Academy of Sciences, U.S.A.]

