- Institution: Stanford Univ Med Ctr Lane Med Lib/Periodical Dept/Rm L109
- Sign In as Member / Individual
The Economics of Drug Abuse: a Quantitative Assessment of Drug Demand
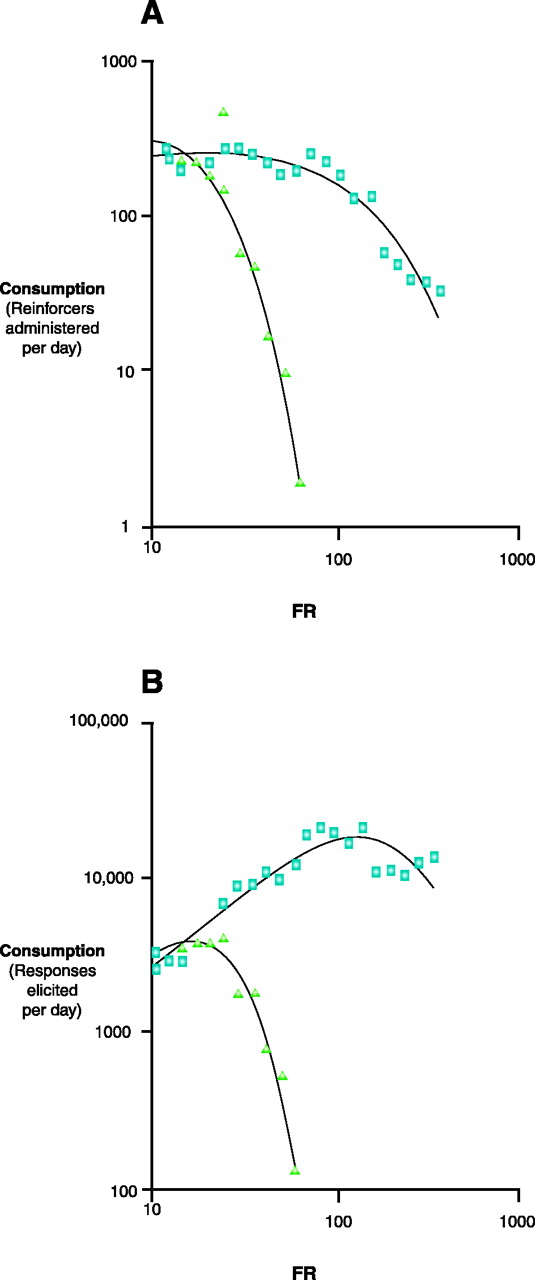
Demand curves describe the relationship between the cost and consumption of behavioral reinforcers. The cost incurred by a rhesus monkey working for either food (squares) or saccharin-sweetened water (triangles) is given as the number of responses (e.g., depression of a lever) required to elicit a unit of reward (e.g., a food pellet). This cost can be varied by the experimenter, whereby the ratio of responses per reward is fixed to a predetermined value [i.e., the fixed-ratio response (FR), plotted on the x axis]. Consumption can be given, on the y axis, as either the number of reinforcers given per day A. or the number of responses elicited per day B. See (21).

