Sites of interest on the World Wide Web—edited by David Roman
The Allen Brain Atlas: Highly Expressive

Founded in 2003, by Paul G. Allen and Jody Allen Patton, the Allen Institute for Brain Science has been using RNA in situ hybridization to investigate the expression of over 20,000 genes in mouse brain. This database (www.brain-map.org) can be examined through the Web site interface or using the Allen Brain Explorer software that is available as a free download for both Windows PCs and Macs. The software package is powerful and highly intuitive, allowing users to view gene expression data sets overlaid on brain regions in three dimensions. The various brain regions are annotated and can be viewed selectively. This powerful program is useful as a neurobiology learning tool and also provides experimentalists with a means for generating scientific hypotheses centered around the expression patterns of genes. Dealing with large bodies of data is never easy, but the Allen Institute does a remarkable job of making complex expression patterns accessible and enjoyable to navigate. Be sure to spend the five minutes to watch the Atlas tour—a great starting point!
RINGdb: Integrated GPCR and RGS Protein Database

The RING database (http://ringdb.csie.ncu.edu.tw/ringdb/) provides a useful resource for researchers interested in G protein–coupled receptors as well and regulators of G protein signaling (RGS) proteins. The database is unique in that it contains a wide variety of mutation data, tissue distributions, sequence data, posttranslational modification annotations, protein–protein interaction data (for RGS proteins), GPCR ligand data, and information on diseases and disorders.
Molecular Cancer Therapeutics

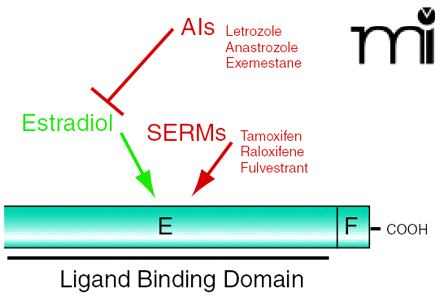
This issue of Molecular Interventions features a Viewpoint article by Mark Nichols that highlights an important aspect in the fight against cancer: tamoxifen resistance. Many different aspects of cancer profiling and treatment can be found at the Genomics and Bioinformatics Group at the National Cancer Institute (http://discover.nci.nih.gov). This Web site provides a wide variety of databases, presenting mutations in known cancers as well as the molecular profiles of the NCI-60 panel of cancer cell lines and drug-resistant and drug-sensitive cell lines. Furthermore, the CellMiner database allows users to query for the molecular profile information. Also very useful are the cDNA microarrary expression data sets for the NCI-60 cancer cell lines, Affymetrix microarry data, and ABC transporter RT-PCR gene expression data. Another great tool is the Smudgeminer for identifying regional biases on microarrays and other artifacts.
GPCR Ligand Database

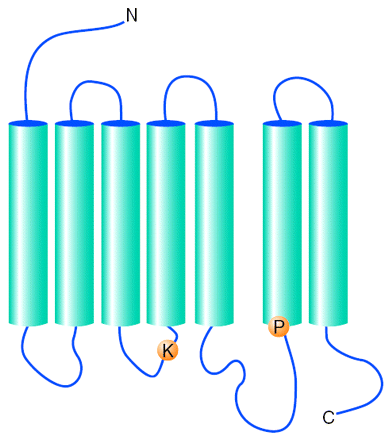
In their Review article this month, Römpler et al. highlight some of the evolutionary aspects of G protein–coupled receptors. A useful tool for studying the function of GPCRs can be found at GLIDA (GPCR-Ligand Database) at the PharmacoInformatics Laboratory at Kyoto University (http://pharmin-fo.pharm.kyoto-u.ac.jp/services/glida/). The site provides information on ligands sorted by historic GPCR classes (Class A, B, C, etc.) as well as putative GPCRs such as the Vomernasal receptors (V1R and V3R), orphans, and taste receptors, as well as unclassified GPCRs. Links for each receptor provide ligand data, structures, PubChem references, and literature citations. The ligand information allows researchers to identify potential off-target effects and otherwise assess experimental ligand choices.
- © American Society for Pharmacology and Experimental Theraputics 2007


