- Institution: Stanford Univ Med Ctr Lane Med Lib/Periodical Dept/Rm L109
- Sign In as Member / Individual
G Protein-Coupled Receptors Go Extracellular: RhoA Integrates the Integrins

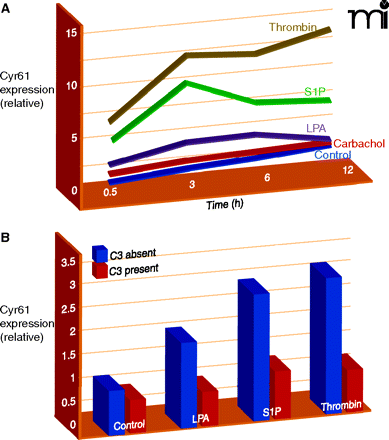
Figure 3.
Kinetic expression profile of Cyr61/CCN1 after GPCR stimulation and Rho dependence of CCN1 protein expression after GPCR stimulation. (A) CCN1 kinetic expression profile in 1321N1 glioblastoma multiforme cells treated with vehicle (Control), 500 μM carbachol, 10 μM lysophosphatidic acid (LPA), 10 μM sphingosine-1-phosphate (S1P), or 0.5 U/ml thrombin. Mean densitometric values for CCN1 normalized by actin are shown. (B) 1321N1 cells were treated overnight with C3 toxin from Clostridium botulinum followed by stimulation with 10 μM lysophosphatidic acid (LPA), 10 μM sphingosine-1-phosphate (S1P), or 0.5 U/ml thrombin for 3 hours.


