|
 
 |
| ORIGINAL ARTICLE |
|
| Year : 2014 | Volume
: 2
| Issue : 2 | Page : 59-64 |
|
Growth status of school children and adolescents in Ebonyi State, Southeast Nigeria
Nto Johnson Nto1, Chike I.P. Anibeze2, Ogugua A Egwu3, Emmanuel Nebuwa Obikili1, Augustine Uchenna Agu1, Godson Emeka Anyanwu1, Francis N Ozoemena1
1 Department of Anatomy, College of Medicine, University of Nigeria, Enugu Campus (UNEC), Enugu, Nigeria
2 Department of Anatomy, College of Medicine, Enugu State University of Science and Technology, Enugu, Nigeria
3 Department of Anatomy, Federal University, Ndufu-Alike Ikwo, Ebonyi, Nigeria
| Date of Web Publication | 23-Mar-2015 |
Correspondence Address:
Nto Johnson Nto
Department of Anatomy, College of Medicine, University of Nigeria, Enugu Campus, Nsukka, Enugu
Nigeria
 Source of Support: None, Conflict of Interest: None  | Check |
DOI: 10.4103/2315-7992.153818

Background: Growth assessment is useful in monitoring children's growth. It often reveals their physical characteristics, health and nutritional status, and infers their biological well-being. The present study was conducted to evaluate the physical growth status of schoolchildren and adolescents in Ebonyi State, Southeast Nigeria. Materials and Methods: A cross-sectional study design was followed, which involved a random sampling of 1,620 subjects (849 males and 771 females) selected from schools in urban and rural communities of the state. Anthropometric measurements included height and weight; the body mass index (BMI) was also assessed and the Centers for Disease Control and Prevention (CDC) 2000 reference standards was used for comparison. Results: The median weight values of the urban subjects (males and females) tend to be higher than the CDC reference standard. The median weight of the rural females compared fairly while the rural males deviated below the reference standard at the age of 10-18 years. Compared to the CDC standards, the median height of the urban and rural subjects tends to be higher during childhood; the urban subjects at the age of 15-18 years deviated below the reference standard while the rural subjects deviated below the reference standard from the age of 13 years. The median BMI values of the urban females were higher than the standard; the urban males and rural females were almost identical to the reference chart. In contrast, the median BMI values of the rural males were below the standard. Conclusion: The age-matched increase in the anthropometric parameters evaluated indicates a normal growth pattern, and there was a marked difference in the anthropometric parameters and growth performance of urban schoolchildren and adolescents compared to their rural counterparts. The growth patterns of schoolchildren and adolescents in Ebonyi State appeared comparable to the CDC growth reference charts. Keywords: Anthropometric, Ebonyi, growth status, Southeast Nigeria
How to cite this article:
Nto NJ, Anibeze CI, Egwu OA, Obikili EN, Agu AU, Anyanwu GE, Ozoemena FN. Growth status of school children and adolescents in Ebonyi State, Southeast Nigeria. Ann Bioanthropol 2014;2:59-64 |
How to cite this URL:
Nto NJ, Anibeze CI, Egwu OA, Obikili EN, Agu AU, Anyanwu GE, Ozoemena FN. Growth status of school children and adolescents in Ebonyi State, Southeast Nigeria. Ann Bioanthropol [serial online] 2014 [cited 2018 Sep 6];2:59-64. Available from: http://www.bioanthrojournal.org/text.asp?2014/2/2/59/153818 |
| Background | |  |
Comparing a child's linear and ponderal growth with the growth charts helps to determine if the child is within the expected range for his/her age and sex. Growth assessment can be achieved by physical anthropometry, which involves the study and technique of taking body measurements; measuring the human body in terms of dimensions, proportions, and ratios. Anthropometry can be used to evaluate an individual or a population. Anthropometric measurements have been used to monitor growth and establish growth reference standards, and often reflect the standard of living, health, and nutritional status of an entire population. [1] Studies have shown that environmental factors, predominantly nutrition and socioeconomic status, appear to be far more important than genetic predisposition in determining the growth status of children and adolescents. [2],[3]
Favorable environmental conditions are important and provide the child with the best opportunity to achieve his/her growth potential especially during school-age, a period when the child is undergoing rapid mental and physical development. [4] It has been documented that urban children grow faster than their rural peers. Also, first born children and those from urban and middle socioeconomic status tend to be taller and weigh heavier than latter born children and those from rural and low socioeconomic status. There is a paucity of data on the growth status of children and adolescents in Nigeria. In view of the above, the present study was aimed at assessing the physical growth status of urban and rural schoolchildren in Ebonyi State, Southeast Nigeria.
| Materials and Methods | | |
Study design and sample size
The study was a cross-sectional survey done by simple random sampling of school subjects aged 5-18 years. The present study was carried out in two towns categorized as urban and rural centers (Abakaliki and Ikwo, respectively) in Ebonyi State. There are both private and public schools in Abakaliki. The school of choice in Abakaliki is Hope High International School: It attracts subjects from high and middle socioeconomic status. The schools used for the study in Ikwo included Anyigba Community School and Divine Mercy Comprehensive School, whose subjects are mostly from low socioeconomic status. A total of 1,620 subjects were selected, which consisted of 849 males (52.4%) and 771 females (47.6%).
Anthropometry
The anthropometric parameters measured were height and weight. An Avery height and weight scale (Avery, Birmingham, England) was used to obtain the measurements. Height was measured to the nearest 0.1 cm as each subject stood erect, barefooted with the head held in Frankfort horizontal plane. Weight was measured to the nearest 0.1 kg with each subject wearing minimal clothing (school sports dress), barefooted, and mounted on the scale as each reading was taken. Body mass index (BMI) was calculated as weight per height squared.

The technique employed in taking the measurements was in accordance with the guidelines suggested by the World Health Organization (WHO) expert committee (1995).
Statistical analysis
The sample data were analyzed using SPSS computer software version 17.0 (IBM, USA). The data were expressed as mean ± standard deviation (SD). The data were compared with the Centers for Disease Control and Prevention (CDC) 2000 reference growth charts.
| Results | | |
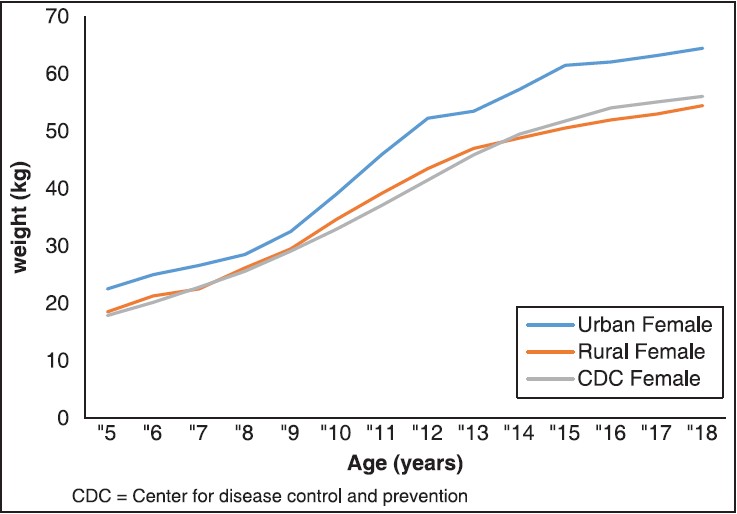
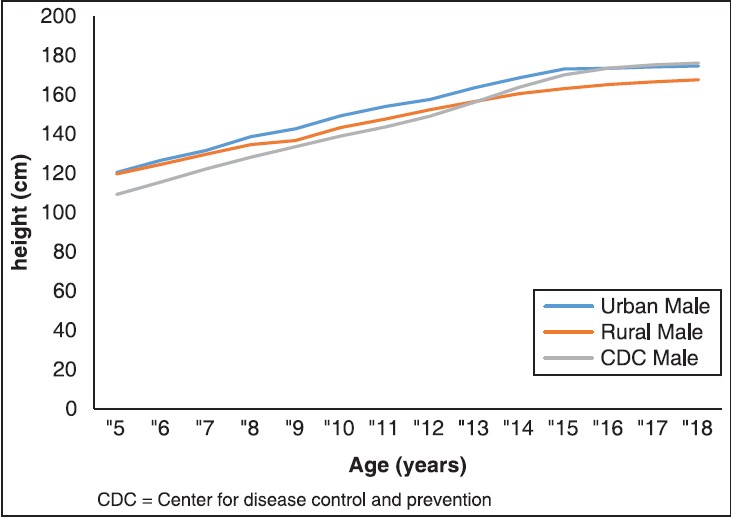
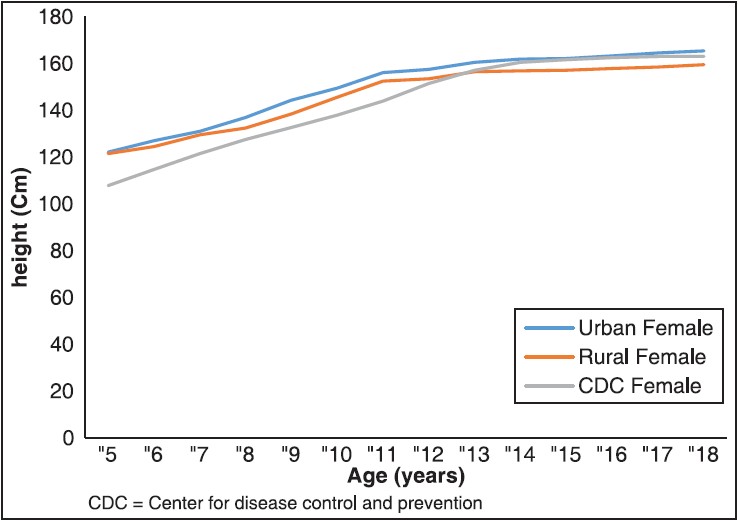
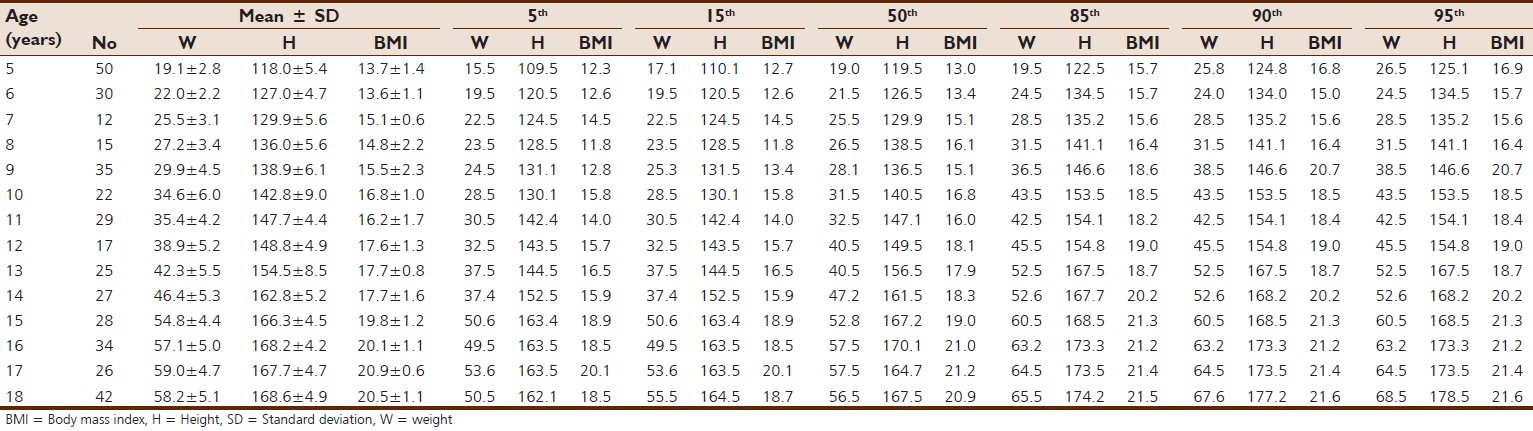
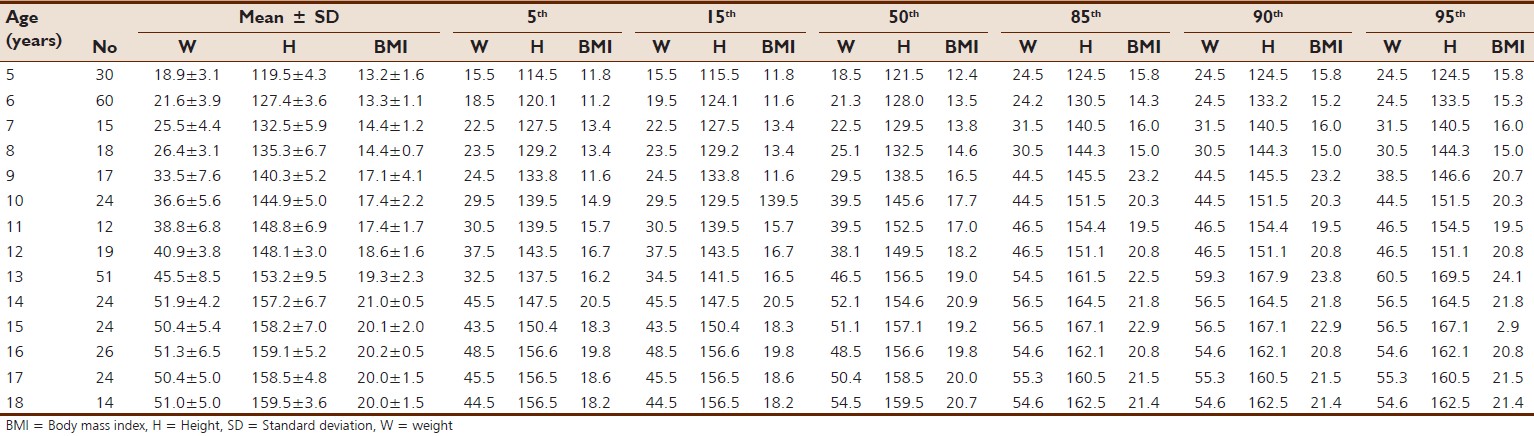
[Table 1], [Table 2], [Table 3] and [Table 4] show the sample size in each age group and their mean ± SD for weight, height, and BMI for urban male and female and rural male and female subjects, respectively, aged 5-18 years. The crude percentiles (5 th , 15 th , 50 th , 85 th , and 95 th ) of weight, height, and BMI are shown. The mean value of the three anthropometric parameters increased with age. [Figure 1] and [Figure 2] compared the smooth 500 percentile of the urban and rural samples compared to that of the CDC standard. The rural females compared fairly, but did deviate at the age of 15-18 years. The rural males were below the CDC standard except for children at the age of 5-9 years. The urban males and females were above the CDC standard at all ages. [Figure 3] and [Figure 4] show the comparison of the smooth median height of the urban and rural subjects with that of the CDC standard. Initially, the urban males and females were above the CDC standard but matched fairly with the CDC standard in adolescence. Of the 500 percentile of the rural sample, the males and females deviated from the CDC standard at the age 13-18 years. [Figure 5] and [Figure 6] display the matching of the smooth 500 percentile BMI of urban and rural subjects with the CDC standard. As shown in [Figure 5], the BMI of the urban males deviated at the age of 9-13 years and thereafter rose above the CDC standard. The rural males were below the CDC standard. [Figure 6] shows that the urban females were above the CDC standard, the rural females were below the standard at the age of 5-7 years and thereafter matched fairly with the CDC standard. 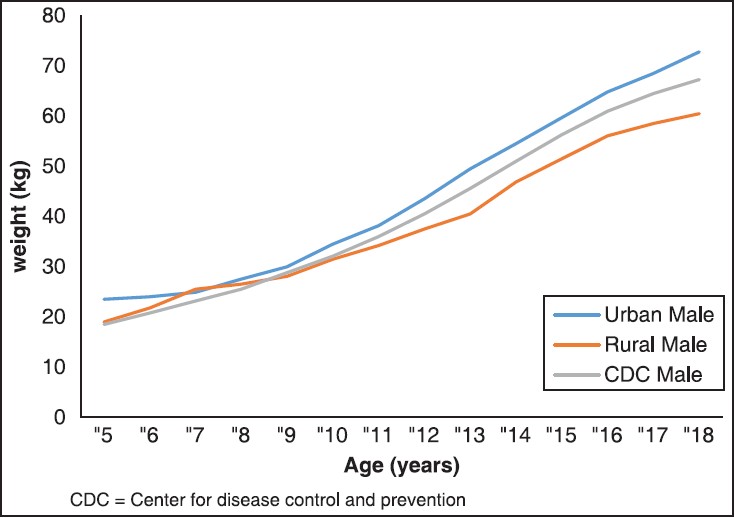 | Figure 1: Compares the smooth median weight of urban and rural male with that of CDC
Click here to view |
 | Figure 2: Compares the smooth median weight of urban and rural female with that of CDC
Click here to view |
 | Figure 3: Compares the smooth median height of urban and rural male with that of CDC
Click here to view |
 | Figure 4: Compares the smooth median height of urban and rural female Ebonyi school children and adolescents with CDC
Click here to view |
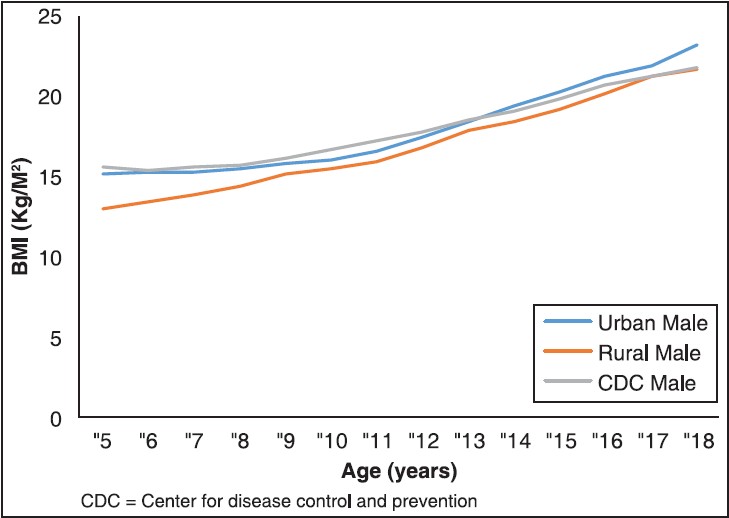 | Figure 5: Compares the smooth median BMI of urban and rural male, Ebonyi school children and adolescents with CDC
Click here to view |
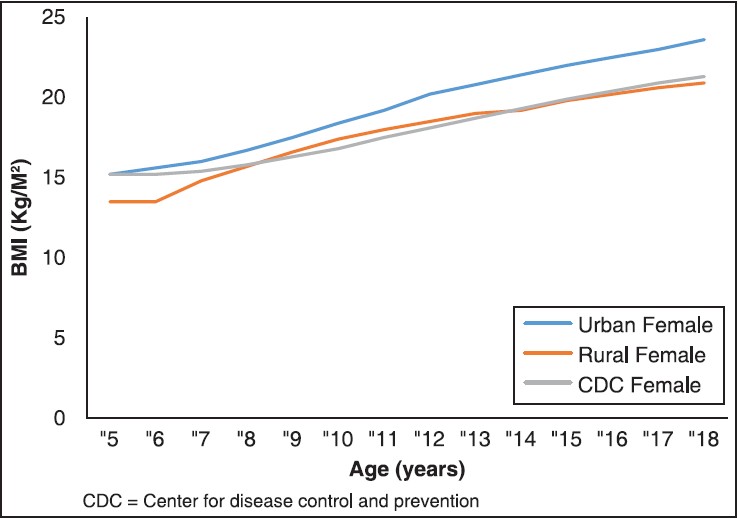 | Figure 6: Compares the smooth median BMI of urban and rural female, Ebonyi school children and adolescents
Click here to view |
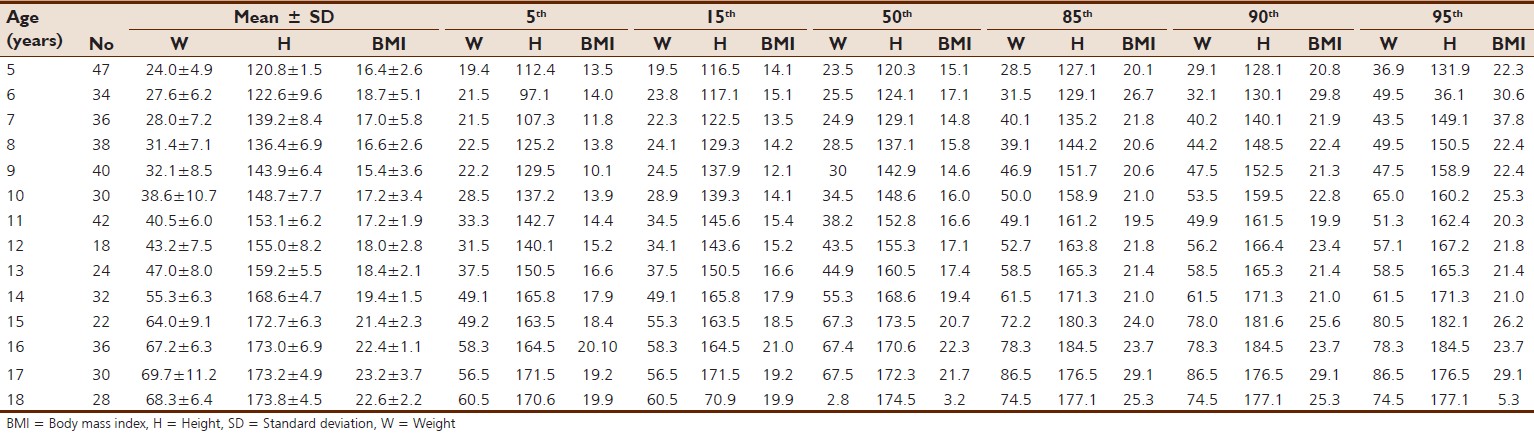 | Table 1: The mean, standard deviation, and crude percentiles for weight (kg), height (cm) and BMI (kg/m2) of urban male aged 5-18 years
Click here to view |
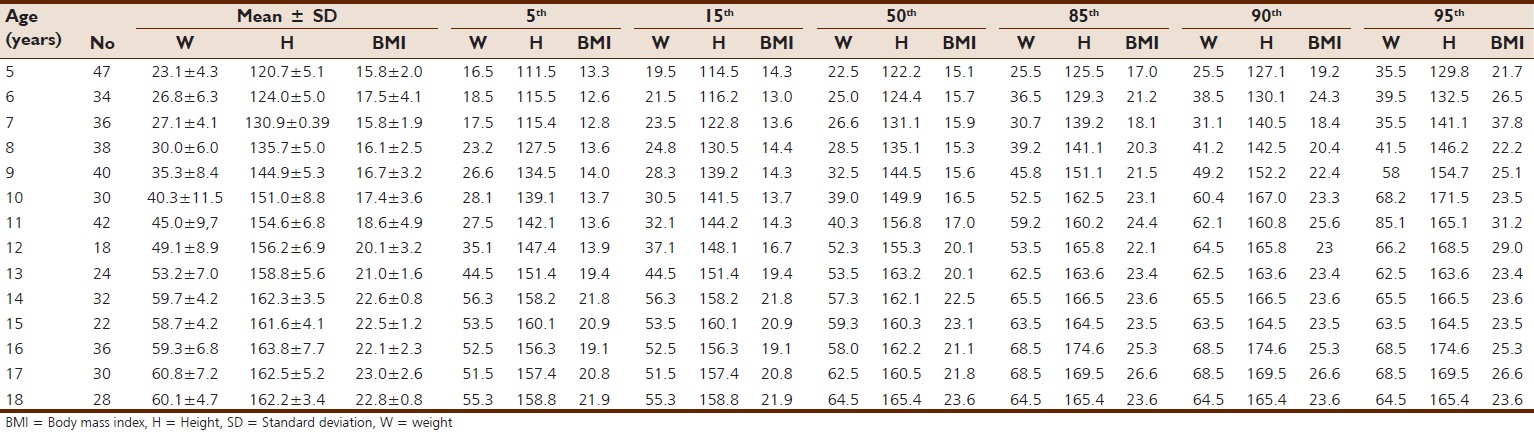 | Table 2: The mean, standard deviation, and crude percentiles for weight (kg), height (cm) and BMI (kg/m2) of urban female aged 5-18 years
Click here to view |
 | Table 3: The mean, standard deviation, and crude percentiles for weight (kg), height (cm) and BMI (kg/m2) of rural males aged 5-18 years
Click here to view |
 | Table 4: The mean, standard deviation, and crude percentiles for weight (kg), height (cm) and BMI (kg/m2) of rural females aged 5-18 years
Click here to view |
| Discussion | | |
Children's growth is a reflection of the standard of living and the quality of life of a population. [5] In both the urban and rural subjects, there was an observed increase in height, weight, and BMI with age in both genders. This suggests normal growth pattern in the subjects.
Growth charts have been used in growth monitoring to identify health- or nutrition-related problems. [5],[6],[7] They give the overall clinical impression of the child under examination. The most used and highly recommended international growth chart has been the CDC 2000 growth charts. This study assessed the physical growth in schoolchildren and adolescents in Ebonyi State by evaluating how well their anthropometric variables matched or diverged from the CDC 2000 growth charts.
An earlier evaluation in Benin City, South-South Nigeria had documented that only the 50 th percentile height of females compared favorably with the international standard and that males were below the standard. [7] The findings of this study, however, reveal that the median height in the urban subjects (males and females) was above the CDC standard at childhood (5-9 years) and early adolescence (10-13 years). Thereafter, they matched fairly with the CDC standard [Figure 3] and [Figure 4]. Moreover, the median weight of the urban subjects (males and females) of this study was above the CDC standard. The contrast between our findings and the previous study [8] may be due to regional/ethnic variation; our study area was in Ebonyi State, Southeast Nigeria and was carried out on the Igbos, whereas that of Nwokoro et al., (2006) [7] was on a population in Benin City, Edo State, South-South Nigeria. However, both the studies were carried out on an urban population and there was a time lapse of about 7 years between them, which may also suggest an improvement in the growth performance of an urban Nigerian population that possibly may be a result of improved economic conditions in Nigeria over the last 10 years or more. The findings of this study also reveal that the urban subjects (males and females) were significantly taller than their rural counterparts of the same gender at the age of 9-18 years (P < 0.05). It had been documented [9],[10],[11] that urban children grow faster and tend to be taller than their rural peers. The influence of environmental factors on human growth is well known; these include nutrition, socioeconomic status and so on. [12] School records show that the urban subjects are from high and middle socioeconomic status, whereas the rural subjects are mostly from low socioeconomic status. Nutrition is an important factor in children's and adolescents' growth and health. [13],[14] Ene-obong and Ekweagwu (2013) [15] documented that most of the rural schoolchildren feed on monotonous diets, which are mainly carbohydrates with little or no protein that is very essential for growth. The difference in nutrition and socioeconomic status between the urban and rural subjects is a pointer to the higher height in the urban subjects compared to their rural counterparts. Secular trend in weight is on the rise and is proposed to be occurring most rapidly in urban areas and among the affluent. [16],[17] Belmont et al. (1975) [18] and Mohanmadzaded et al. (2010) [11] in their separate studies documented that maternal education is associated with higher weight and height in children, and children who live in urban centers have more weight than their rural peers. The findings of this study reveal more weight in the urban subjects than their rural counterparts. Influence of affluence, personality profile of the parents, and lifestyle play an important role in this trend. An observed trait among the urban subjects is the craving for delicacies high in sugar and fat but low in fiber content; the growing number of fast food joints in the urban centers attest to this. The rural subjects on the other hand do not get appropriate diet necessary for their mental and physical development. Ene-Obong and Ekweagwu (2013) [15] documented that the rural subjects get little or no protein diets. The rural subjects walk a distance to and from school each day, they are also made to cut grasses occasionally; these contribute as a measure of physical activities. On the contrary, the urban subjects are driven to and from school, making them more prone to a sedentary lifestyle. These factors, possibly, are responsible for more weight in the urban subjects than in the rural subjects.
The findings of this study show that the 50 th percentile BMI of urban females was higher than the CDC standard; that of the urban males was lower but matched with the CDC standard from the age of 9-18 years [Figure 5] and [Figure 6]. A study in Sokoto, Northwest Nigeria [13] documented low BMI values that were comparable to the CDC 2000 BMI charts. The contrast between this study and the study in Sokoto suggests regional variations probably due to the effects of culture, genetics, and nutritional status at the community and household levels.
| Conclusion | | |
The age-matched increase in the anthropometric parameters evaluated indicates a normal growth pattern and there was a marked difference in the anthropometric parameters and growth performance of urban schoolchildren and adolescents compared to their rural counterparts. The growth patterns of schoolchildren and adolescents in Ebonyi State were comparable to the CDC growth reference charts.
| References | | |
| 1. | Agu AU, Anyanwu GE, Ezegworie JO, Obikili EN. Anthropometric measurements and sexual dimorphism in school children and adolescents in Enugu Nigeria. Sci J Med Clin T, Article ID sjmct-119, 2014;3:5.  |
| 2. | Tanner JM. Growth in height is a mirror of the standard of living. In: Komlos J, editor. Stature, Living Standards and Economic Development: Essays in Anthropometric History. Vol. 8. Chicago, IL: University of Chicago Press; 1994. p. 192-205. |
| 3. | de Onis M, Onyango AW, Borghi E, Siyam A, Nishida C, Siekmann J. Development of a WHO growth reference for school-aged children and adolescents. Bull World Health Organ 2007;85:660-7. |
| 4. | Giles H, Lucas A. Short Text Book of Public Health Medicine for the Tropics. 4 th ed. London: Hodder Arnold; 2003. p. 353-60. |
| 5. | Kulaga Z, Litwin M, Tkaczyk M, Rózdzyńska A, Barwicka K, GrajdaA, et al. The height-, weight-, and BMI-for-age of Polish school age children and adolescents relative to international and local growth references. BMC Public Health 2010;10:109. |
| 6. | Bener A, Kamal AA. Growth patterns of Qatari school children and adolescents aged 6-18 years. J Health Popul Nutr 2005;23:250-8. |
| 7. | Nwokoro SO, Ifada K, Onochie O, Olomo JM. Anthropometric assessment of nutritional status and growth of 10-20 years old individuals in Benin City (Nigeria) Metropolis. Pak J Nutr 2006;5:117-21. |
| 8. | Gharib NM, Shah P. Anthropometry and body composition of school children in Bahrain. Ann Saudi Med 2009;29:258-69. |
| 9. | Eiben OG, Mascie-Taylor CG. Children's growth and socio-economic status in Hungary. Econ Hum Biol 2004;2:295-320. |
| 10. | Eiben OG, Barabas A, Kontra G, Panto E. Differences in growth and physical fitness of Hungarian urban and rural boys and girls. Homo 1996;47:191-205. |
| 11. | Mohammadzadeh A, Farhat A, Amiri R, Esmaeeli H. Effect of birth weight and socioeconomic status on children's growth in Mashhad, Iran. Int J Pediatr 2010;2010:705382. |
| 12. | Schell LM, Gallo MV, Ravenscroft J. Environmental influences on human growth and development: Historical review and case study of contemporary influences. Ann Hum Biol 2009;36: 459-77. |
| 13. | Singh SP, Promila M. Growth, maturation and physical performance. A textbook of Human body measurements. Rag Press 2009;8:192-205. |
| 14. | Ahmad MM, Ahmed H, Airede K. Body mass index among school adolescents in Sokoto, North-Western Nigeria. Sahel Med J 2013;16:5-9.  |
| 15. | Ene-Obong HN, Ekweagwu E. Dietry Habits and Nutritional status of rural school age children in Ebonyi state, Nigeria. Nig J Nutr Sci 2012;33:23-30. |
| 16. | Delpeuch F, Maire B. Obesity in in developed countries of the south. Med Trop (Mars) 1997;57:380-8. |
| 17. | Uauy R, Albala C, Kain J. Obesity trends in Latin America: Transiting from under- to overweight. J Nutr 2001;131:893-9S. |
| 18. | Belmont L, Stein ZA, Susser MW. Comparison of associations of birth order with intelligence test score and height. Nature 1975;255:54-6. |
[Figure 1], [Figure 2], [Figure 3], [Figure 4], [Figure 5], [Figure 6]
[Table 1], [Table 2], [Table 3], [Table 4]
|


 Search Pubmed for