|
 
 |
| ORIGINAL ARTICLE |
|
| Year : 2016 | Volume
: 4
| Issue : 2 | Page : 111-117 |
|
Estimation of total muscle mass from simple anthropometric measurements for adults of Igbo ethnic group of South East Nigeria
Esomonu G Ugochukwu
Department of Anatomy and Forensic Anthropology, Faculty of Basic Medical Sciences, Cross River University of Technology, Okuku Campus, Cross River State, Nigeria
| Date of Web Publication | 18-Apr-2017 |
Correspondence Address:
Esomonu G Ugochukwu
Department of Anatomy and Forensic Anthropology, Faculty of Basic Medical Sciences, Cross River University of Technology, Okuku Campus, Cross River State
Nigeria
 Source of Support: None, Conflict of Interest: None  | Check |
DOI: 10.4103/aoba.aoba_1_17

Introduction: Skeletal muscle mass represents about 30%–40% of the total body weight, and total body skeletal muscle mass plays a significant role in both health and disease states such as maintaining and changing posture, protein synthesis, and metabolism. This study is aimed at deriving predictive equations for estimating total muscle mass from simple anthropometric measurements such as body mass index, mid-arm circumference (MAC), and triceps skinfolds (TSF) for the Igbo ethnic group of South East Nigeria. Materials and Method: Anthropometric measurements of body weight, height, MAC, and skinfold measurement were carried out on 3000 adults of the age range of 18–40. They comprised 1500 each of males and females. A prediction equation for the measurement of muscle mass was derived using the measured anthropometric parameters which include the MAC and TSF. Result: The prediction equation obtained for muscle mass (kg) using MAC alone irrespective of age and gender for the Igbo ethnic group was (0.6731× MAC + [−5.407]). Conclusion: The result of this study is relevant to medical practitioners in the evaluation and detection of depletion of muscle mass that has occurred either physiologically or pathologically in adults; it will also prove useful in the field of medical anthropology, nutrition, and sports anatomy.
Keywords: Body mass index, Igbo ethnic group, mid-arm circumference, skeletal muscle mass, total muscle mass
How to cite this article:
Ugochukwu EG. Estimation of total muscle mass from simple anthropometric measurements for adults of Igbo ethnic group of South East Nigeria. Ann Bioanthropol 2016;4:111-7 |
How to cite this URL:
Ugochukwu EG. Estimation of total muscle mass from simple anthropometric measurements for adults of Igbo ethnic group of South East Nigeria. Ann Bioanthropol [serial online] 2016 [cited 2017 May 4];4:111-7. Available from: http://www.bioanthrojournal.org/text.asp?2016/4/2/111/204678 |
| Introduction | |  |
Anthropometric measurement is a set of noninvasive, quantitative techniques for determining an individual's body composition by measuring, recording, and analyzing specific dimensions of the body such as height and weight; skin-fold thickness; and body circumference at the waist, hip, chest, etc.
Skeletal muscle or voluntary muscle is responsible for maintaining posture and locomotion. The total body skeletal muscle mass plays a significant role in both health and disease states such as maintaining and changing posture, protein synthesis, and metabolism.[1],[2]
In a country like Nigeria, there is a need for the medical practitioners to know the average muscle mass of individuals in the country to detect or differentiate between physiological and pathological degeneration of muscle using simple anthropometric measurements such as body mass index (BMI), mid-arm circumference (MAC), and triceps skinfolds (TSF).
BMI is defined as the ratio of weight to the squared meter of height. The BMI quantifies the amount of tissue mass (muscle, fat, and bone) in an individual and then categorize that person as underweight, normal weight, overweight, or obese based on that value.[3]
MAC is the circumference of the left upper arm, measured at the midpoint between the tip of the shoulder (acromial process) and the tip of the elbow (olecranon process). In children, MAC is useful for the assessment of nutritional status.[4] It is good at predicting mortality, and in some studies, MAC alone or MAC for age predicted death in children better than any other anthropometric indicator.[5] It is, however, increasingly being used to assess adult undernutrition during famine.[6],[7] MAC which is less affected than BMI by the localized accumulation of excess fluid (pedal edema, periorbital edema, and ascites) common in famine has proven to be a more sensitive index of tissue atrophy than low body weight, and it is also relatively independent of height.[7]
Skinfold thickness at selected areas offers a simple method of subcutaneous fat assessment and provides a good estimate of obesity and body fat distribution. There are different recognized areas of taking skinfold measurements which include biceps, triceps, subscapular, suprailiac, quadriceps, abdominal, and chest.[8] Triceps areas are the popular site chosen to assess subcutaneous fat in participants because it is the part that is easily exposed and more convenient to the participants also, it has shown better results for obesity screening, and the component of overweight that leads to pathology compared to other sites.[8] Martin et al. in 1990 revealed that human body muscle mass can be determined using anthropometric measures of girth and skinfolds.[9]
Another method for determining muscle mass is through the measurement of the 24 h urinary excretion of creatinine. This method is based on the correlation between total body creatinine and urinary excretion of creatinine and assumes that nearly all creatinine is within muscle tissue, that muscle creatinine content remains constant, and that creatinine is excreted at a uniform rate.[2],[10]
The aim of this study is to derive predictive equations for estimating total muscle mass (TMM) from simple anthropometric measurements such as BMI, MAC, and TSF of the Igbos of South East Nigeria. This study will be relevant to medical practitioners in the evaluation and detection of depletion of muscle mass that has occurred either physiologically or pathologically in adults.
| Materials and Methods | | |
Subjects
Three thousand adults were randomly selected from the ages of 18 to 40. They comprised 1500 healthy males and females from the Igbo ethnic group. This measurement was carried out strictly among individuals that are free from any disease or deformity. However, participants were informed on the purpose of the measurement before it was carried out.
Research methodology
All measurements of this research were taken and recorded to ensure reliability and accuracy in data. All measurement per day was taken within the hours of 7:30 am to 12 pm. People are more relaxed in the morning hours, and they tend to decrease in height toward evening.[11] Each measurement was taken 3 times to ensure the accuracy of data. This research was conducted within 60 days.
Measurement procedures
Anthropometric measurements of body weight, height, MAC, and skinfold measurement were carried out on 3000 participants with a wide range of BMIs.
Height
This measurement was taken with the participant standing erect without shoes or socks, with the heels put together, and the eyes directed straight ahead. The participants stood erect against a wall, having his/her buttocks, shoulder blades, and back of head in close contact with the wall, and the head placed in a position called the “Frankfurt plane.”
In this described position, the measurement is taken with an anthropometer placed on the same leveled floor with the sole of the foot of the participant and the pointer place directly horizontal to the participant's vertex as shown in [Figure 1]. | Figure 1: Experimental measurement of height in male using anthropometer
Click here to view |
Weight
Participants were weighed in minimal clothing using a SECA electronic digital weighing scale to the nearest 0.5 kg this measurement was taken 3 times to ensure accuracy in data. This is shown in [Figure 2].
Mid-arm circumference
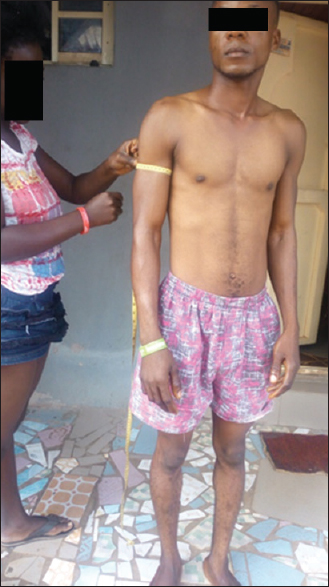
The MAC was measured with the participant standing erect. The participant's elbow was flexed to 90°, and the midpoint between the tip of acromion and olecranon process will be located. The tape will be placed around the arm at the midpoint, with the arm relaxed, elbow extended [Figure 3], and the circumference value was estimated to the nearest 0.1 cm.
Skinfold measurement
TSF measurement was carried out in triplicate in the standing position and the mean was taken for further calculation. The TSF was measured in the midline of the posterior aspect of the arm, over the triceps muscle, at a point midway between the lateral projection of the acromion process of the scapula and the inferior margin of the olecranon process of the ulna [Figure 4]. The skinfold measurement was estimated to the nearest 0.5 mm using Numed Sal Digital skinfold caliper (ABSE004). | Figure 4: Experimental measurement of triceps skinfolds in male using a digital skinfold caliper
Click here to view |
Body mass index
BMI was calculated from the height and weight as follows: BMI = weight (kg)/height (m2)
Corrected arm muscle area
The corrected arm muscle area (CAMA) was calculated using the following formula:
(MAC –[π × TSF]) −10/4π (Kuriyan and Kurpad, 2004).
TSF and MAC is measured in centimeter and the correction factor for bone area is 10.
Total muscle mass
TMM was calculated from CAMA using the equation derived by Kuriyan and Kurpad, in 2004[1] as follows:
TMM (kg) = Height × (0.0264+ [0.0029× CAMA]).
Statistical analysis
Data obtained were analyzed, and mean values were derived for BMI, MAC, TSF, and TMM. Student's t-test was used to compare differences in BMI, MAC, TSF, and TMM between the genders. One-way ANOVA was used to compare the difference between age groups. Pearson's correlation coefficient was used to determine the association between TMM and the other parameters. Linear regression was carried out to determine equations for the estimation of TMM from the other parameters. A significant difference was taken at P < 0.05.
| Results and Observation | | |
Three thousand healthy participants were randomly selected from the ages of 18 to 40 from the Igbo ethnic group. They comprised 1500 healthy males and females, respectively. Sexual dimorphic analysis for the age group of 18–24 showed a significant difference (P < 0.05) for MAC and TMM obtained for Igbo ethnic group. It was observed that the values of MAC (31.83 ± 1.81) and TMM (16.08 ± 1.09) of males were significantly higher than that of the females (30.87 ± 1.37; 15.53 ± 0.86, respectively) of the Igbo ethnic group. The mean values for the age group of 25–32 showed a significant difference (P < 0.05) in gender for BMI, MAC, and TSF for Igbo ethnic group. It is observed that the values of BMI, MAC, and TSF of males are significantly higher than females. The mean values for ages 33–40 showed no significant difference in gender for all parameters obtained for Igbo ethnic group. Irrespective of age, results showed a significant difference (P < 0.05) in gender for BMI, MAC, and TMM for the Igbo ethnic group. It was observed that the BMI, MAC, and TMM of males were significantly higher than females [Table 1].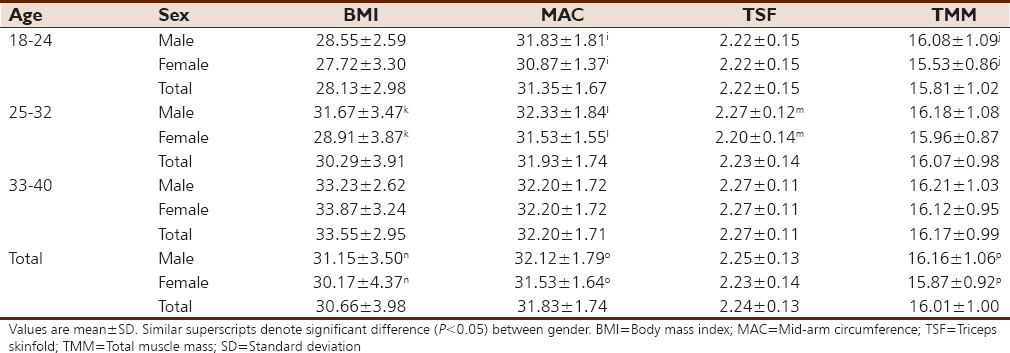 | Table 1: Body mass index, mid-arm circumference, triceps skinfolds, and total muscle mass of Igbo for males, females, and irrespective of gender
Click here to view |
Correlation analysis for the age group of 18–24 showed that TMM is not significantly correlated to BMI; however, TMM is significantly correlated (P < 0.05) to TSF for males, females, and irrespective of gender. TMM is significantly correlated (P < 0.05) to MAC for males, females, and irrespective of gender for this age group. Analysis for age group of 25–32 showed no significant correlation of TMM to BMI and TSF. However, TMM is also significantly correlated (P < 0.05) to MAC for males, females, and irrespective of gender for this age group. Analysis for age group of 33–40 showed a significant correlation (P < 0.05) of TMM to BMI for males only and irrespective of gender. TMM is significantly correlated (P < 0.05) to MAC for males, females and irrespective of gender for this age group. However, TMM is significantly correlated (P < 0.05) to TSF for males only and irrespective of gender for this age group. Irrespective of age and irrespective of gender and age, TMM shows no correlation to BMI; nevertheless, TMM is significantly correlated (P < 0.05) to MAC. Irrespective of age, TMM is significantly correlated (P < 0.05) to TSF as well as irrespective of age and gender [Table 2].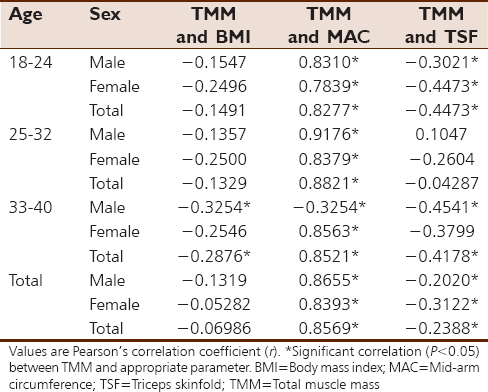 | Table 2: Correlation of total muscle mass to body mass index, mid-arm circumference, or triceps skinfolds of Igbo for males, females, and irrespective of gender
Click here to view |
Linear regression equations for estimating TMM from other measured parameters of the Igbo ethnic group were determined and are presented in [Table 3]. Equations with a significant effect on linear regression are more accurate for estimating TMM. As shown in [Table 3], equations using MAC to estimate TMM have significant effects (P < 0.05), across all age groups, gender as well as irrespective of age and gender. Equations using BMI for estimating TMM show significant effects (P < 0.05) for males only of age group of 33–40, as well as irrespective of gender of age group of 33–40. Equations using TSF for estimating TMM show significant effects (P < 0.05) for females only of age group of 18–24, as well as irrespective of gender of age group of 18–24. Furthermore, equation using TSF for estimating TMM shows a significant effect (P < 0.05) for males and females, as well as irrespective of gender of age group of 33–40, males and females only irrespective of age as well as irrespective of gender and age [Table 3].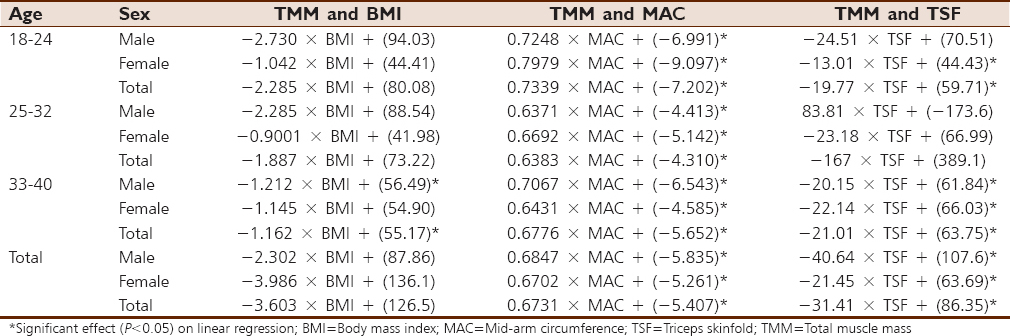 | Table 3: Linear regression equation for the estimation of total muscle mass from body mass index, mid-arm circumference, or triceps skinfold of Igbo for males, females, and irrespective of gender
Click here to view |
One-way ANOVA analysis of BMI showed a significant difference (P < 0.05) for males across the all age groups. There is a significant difference (P < 0.05) between males aged 18–24 and 25–32, between males aged 18–24 and 33–40, and between males aged 25–32 and 33–40. Furthermore, a significant difference (P < 0.05) in BMI was observed for females across the various age groups. There is a significant difference between females aged 18–24 and 33–40, and between females aged 25–32 and 33–40. Irrespective of gender, One-way ANOVA showed a significant difference (P < 0.05) in BMI across all age groups. Irrespective of gender, there is a significant difference between ages 18–24 and 25–32, between ages 18–24 and 33–40, and between ages 25–32 and 33–40 [Figure 5]a.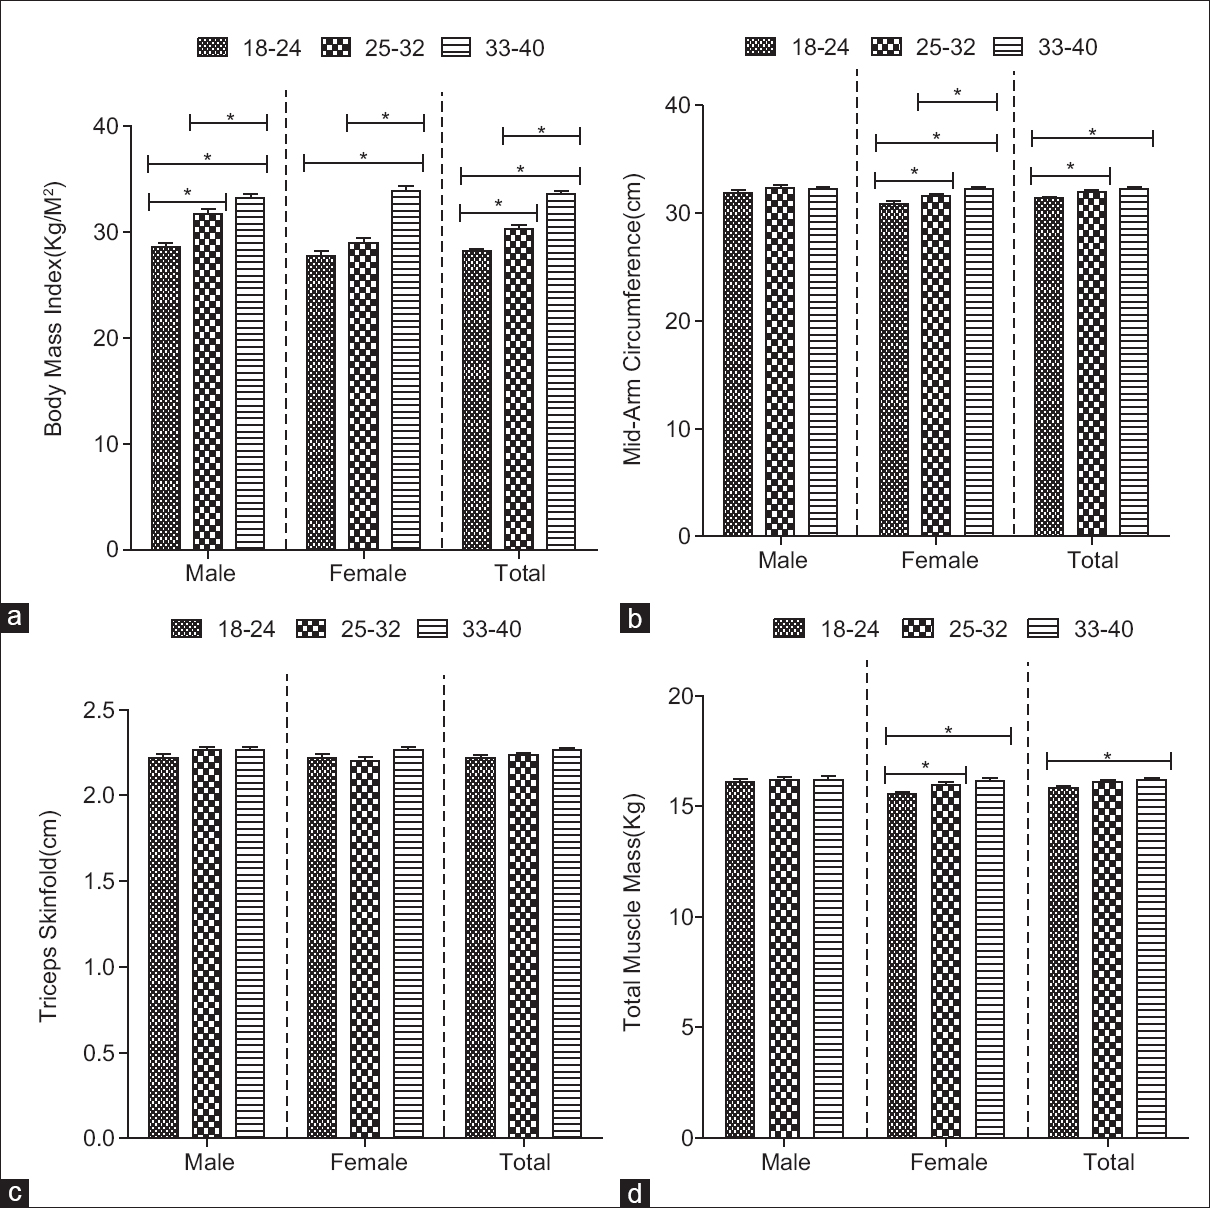 | Figure 5: Comparing body mass index (a), mid-arm circumference (b), triceps skinfolds (c), and total muscle mass (d) across age groups of Igbo for males, females, and irrespective of gender. Bars are mean ± standard error of the mean. * denotes significant difference at P < 0.05. One-way ANOVA followed by Newman–Keuls tests for multiple comparisons
Click here to view |
One-way ANOVA analysis of MAC showed no significant difference for males across the various age groups. A significant difference (P < 0.05) in MAC was observed for females across all age groups. There is a significant difference (P < 0.05) between females aged 18–24 and 25–32 and between females aged 18–24 and 33–40. Irrespective of gender, there is a significant difference (P < 0.05) in MAC across age groups. Irrespective of gender, a significant difference (P < 0.05) between ages 18–24 and 25–32, between ages 18–24 and 33–40, and between females aged 25–32 and 33–40 is observed [Figure 5]b.
One-way ANOVA analysis of TSF showed no significant difference for males and females across the various age groups, as well as no significant difference irrespective of gender [Figure 5]c.
One-way ANOVA analysis of TMM showed no significant difference for males across the various age groups. Significant difference (P < 0.05) in TMM was observed for females across various age groups. There is a significant difference (P < 0.05) between females aged 18–24 and 25–32 and between females aged 18–24 and 33–40. Irrespective of gender, there is a significant difference (P < 0.05) in TMM across age groups. Irrespective of gender, a significant difference (P < 0.05) between ages 18–24 and 33–40 is observed [Figure 5]d.
| Discussion | | |
The estimations of total skeletal muscle mass provide understanding into symptoms of muscle deformities in several conditions as well as provide a clue to progress in muscle rehabilitation. Skeletal muscles are involved in many biological processes; therefore, its quantification provides important insights. Moreover, since muscle atrophy is related to symptom intensity, functional capacity, and quality of life, treating muscle atrophy is beneficial to the patients.[1],[2] Using the Igbos as participants, this study examined the relationship between TMM and simple anthropometric parameters such as BMI, MAC, and TSF. Furthermore, this study provided equations for the prediction of TMM from these simple anthropometric parameters. In addition, the study evaluated gender differences for the parameters obtained.
In the present study, the Igbo male BMI of 31.13 ± 3.50 was significantly higher than their female counterparts (30.17 ± 3.98). The previous study carried out in Ile-Ife, Nigeria, provided comparable values, with males at 23.55 ± 3.78 and females at 23.34 ± 4.00.[12] BMI is currently the most common used and widely acceptable method of weight classification and definition of medical risk of weight problems.[13] In the present study, average BMI obtained from the Igbos falls within the category of Class I obesity according to the WHO classification.[3] This suggests that most of the population are either preobese (overweight) or at the very least have Class I obesity. Although BMI is a useful determinant of adiposity in early and mid-aged adults, it is noteworthy that BMI is restricted due to its inability to recognize between fat mass and fat-free mass. Skeletal muscles are a major component of the fat-free mass.[14],[15] However, direct quantification of TMM of the body is not feasible; hence, the need for estimation from anthropometric measurements, which provides the simplest method, as compared to estimation from other procedures such as computed tomography and magnetic resonance imaging.[16] Our results showed that BMI did not significantly correlate with TMM in neither males nor in females. This suggests a poor association between TMM and BMI among this Nigerian population, and that linear regression equation derived for estimating TMM using BMI will be inaccurate for such estimation in this population.
The present study showed a significant difference in the mean values of MAC. Irrespective of age, there was significant gender dimorphism noted, with a mean value for males (32.12 ± 1.79 cm) being significantly higher than that of females (31.53 ± 1.64 cm). A study among Indian young adult males of student population aged 18–30 provided MAC values of 25.9 ± 1.4 cm.[1] In comparison with young adults in the present study, our data suggest that the Igbos (of Nigeria) have higher MAC and may be thus more muscular compared to these Indians. MAC is a quick and easy method for assessing nutritional status and requires neither advanced training supervision nor equipment.[17] It is mostly used to assess nutritional status in children; however, reports have suggested that MAC may be used to predict muscularity in individuals.[18],[19] At the level of mid-arm, the combined mass of anterior and posterior arm compartment muscles, particularly the prominence of the biceps anteriorly and triceps posteriorly, may afford a good measure for estimating TMM. In the present study, MAC significantly correlated with TMM in both males and females, and across all age groups and irrespective of gender and age for the Igbos. Thus, in contrast to correlation of BMI to TMM, MAC is strongly associated with TMM. Therefore, linear regression equations derived for estimating TMM using MAC were accurate for the population under consideration.
The present study showed no significant gender difference in the TSF among the Igbos irrespective of age. TSF, as with MAC, is also used to assess nutritional status and to predict an individual muscularity [18] although in the present study, TSF did not significantly correlate with TMM in most instances. Nevertheless, among the Igbos, there was a significant correlation between TMM and TSF for both males and females irrespective of age, as well as a significant correlation irrespective of gender and age.
Collectively, correlation analysis in the present study indicates that MAC is most suitable for estimating body muscle mass compared to BMI and TSF. This is probably due to the fact that MAC is mostly influenced by muscle prominence at the mid-arm which is at variance to BMI which is influenced by weight (including fat mass and fat-free mass) and TSF which may be influenced by skin fat under the fold that is measured. It is also noteworthy that among the Igbos, males have higher TMM compared to females irrespective of age. This is likely due to the fact that males are physiologically more muscular compared to their female counterparts.
| Conclusion | | |
The present study has documented anthropometric values for BMI, MAC, and TSF for the Igbos, as well as provided prediction equations for the estimation of TMM from these anthropometric parameters. Importantly, this study has shown that MAC is most accurate for estimating TMM compared to BMI and TSF in these populations. This study will be relevant to medical practitioners in the evaluation and detection of depletion of muscle mass that has occurred either physiologically or pathologically in adults. It will also prove useful in the field of medical anthropology, nutrition, and sports anatomy.
Declaration of patient consent
The authors certify that they have obtained all appropriate patient consent forms. In the form the patient(s) has/have given his/her/their consent for his/her/their images and other clinical information to be reported in the journal. The patients understand that their names and initials will not be published and due efforts will be made to conceal their identity, but anonymity cannot be guaranteed.
Financial support and sponsorship
Nil.
Conflicts of interest
There are no conflicts of interest.
| References | | |
| 1. | Kuriyan R, Kurpad AV. Prediction of total body muscle mass from simple anthropometric measurements in young Indian males. Indian J Med Res 2004;119:121-8.  |
| 2. | Kuriyan R, Thomas T, Kurpad AV. Total body muscle mass estimation from bioelectrical impedance analysis and simple anthropometric measurements in Indian men. Indian J Med Res 2008;127:441-6. [ PUBMED] [Full text] |
| 3. | World Health Organization, editor. Defining the problem of overweight and obesity. In: Obesity: Preventing and Managing the Global Epidemic. Report of a WHO Consultation. Geneva: World Health Organization; 2000. p. 241-3. |
| 4. | World Health Organization. Use and interpretation of anthropometric indicators of nutritional status. WHO working group. Bull World Health Organ 1986;64:929-41. |
| 5. | Chen LC, Chowdhury A, Huffman SL. Anthropometric assessment of energy-protein malnutrition and subsequent risk of mortality among preschool aged children. Am J Clin Nutr 1980;33:1836-45. |
| 6. | Olukoya AA. Identification of underweight women by measurement of the arm circumference. Int J Gynaecol Obstet 1990;31:231-5. |
| 7. | Collins S. Using middle upper arm circumference to assess severe adult malnutrition during famine. JAMA 1996;276:391-5. |
| 8. | Ahmad MM, Ahmed H, Airede KI. Triceps skinfold thickness as a measure of body fat in Nigerian adolescents. Niger J Paediatr 2013;40:179-83. |
| 9. | Martin AD, Spenst LF, Drinkwater DT, Clarys JP. Anthropometric estimation of muscle mass in men. Med Sci Sports Exerc 1990;22:729-33. |
| 10. | Heymsfield SB, Arteaga C, McManus C, Smith J, Moffitt S. Measurement of muscle mass in humans: Validity of the 24-hour urinary creatinine method. Am J Clin Nutr 1983;37:478-94. |
| 11. | Montagu MF, Ashley BJ. A Hand Book of Anthropometry. Springfield, IL, US: Charles C Thomas Publisher; 1960. p. 3-8. |
| 12. | Mbada CE, Adedoyin RA, Odejide AS. Relationship between socioeconomic status and body mass index among adult Nigerians. Afr J Physiother Rehabil Sci 2009;1:1-6. |
| 13. | Leitzmann MF, Moore SC, Koster A, Harris TB, Park Y, Hollenbeck A, et al. Waist circumference as compared with body-mass index in predicting mortality from specific causes. PLoS One 2011;6:e18582. |
| 14. | Seidell JC, Pérusse L, Després JP, Bouchard C. Waist and hip circumferences have independent and opposite effects on cardiovascular disease risk factors: The Quebec family study. Am J Clin Nutr 2001;74:315-21. |
| 15. | Schreiner PJ, Terry JG, Evans GW, Hinson WH, Crouse JR 3 rd, Heiss G. Sex-specific associations of magnetic resonance imaging-derived intra-abdominal and subcutaneous fat areas with conventional anthropometric indices. The atherosclerosis risk in communities study. Am J Epidemiol 1996;144:335-45. |
| 16. | Lee RC, Wang Z, Heo M, Ross R, Janssen I, Heymsfield SB. Total-body skeletal muscle mass: Development and cross-validation of anthropometric prediction models. Am J Clin Nutr 2000;72:796-803. |
| 17. | Goossens S, Bekele Y, Yun O, Harczi G, Ouannes M, Shepherd S. Mid-upper arm circumference based nutrition programming: Evidence for a new approach in regions with high burden of acute malnutrition. PLoS One 2012;7:e49320. |
| 18. | Datta S, Chattopadhyay S, Das AS, Mitra C. Fat free mass and upper arm muscle area as measures of muscularity in tribal and non-tribal Indian college students. J Sci Res Rep 2015;5:295-306. |
| 19. | Trowbridge FL, Hiner CD, Robertson AD. Arm muscle indicators and creatinine excretion in children. Am J Clin Nutr 1982;36:691-6. |
[Figure 1], [Figure 2], [Figure 3], [Figure 4], [Figure 5]
[Table 1], [Table 2], [Table 3]
|


 Search Pubmed for