
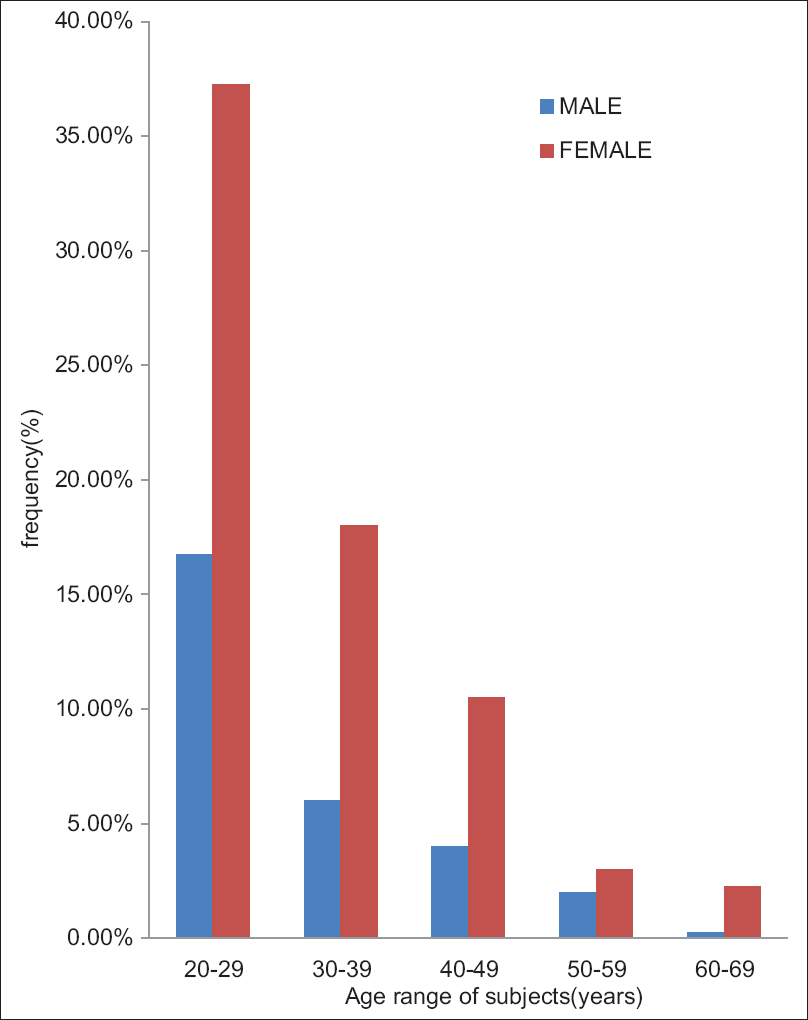
Figure 2: Bar chart showing percentage distribution of age groups (in years) among the subjects (n = 400) in both sexes
| Close | |
|
|
|
|
Figure 2: Bar chart showing percentage distribution of age groups (in years) among the subjects (n = 400) in both sexes
|
|