
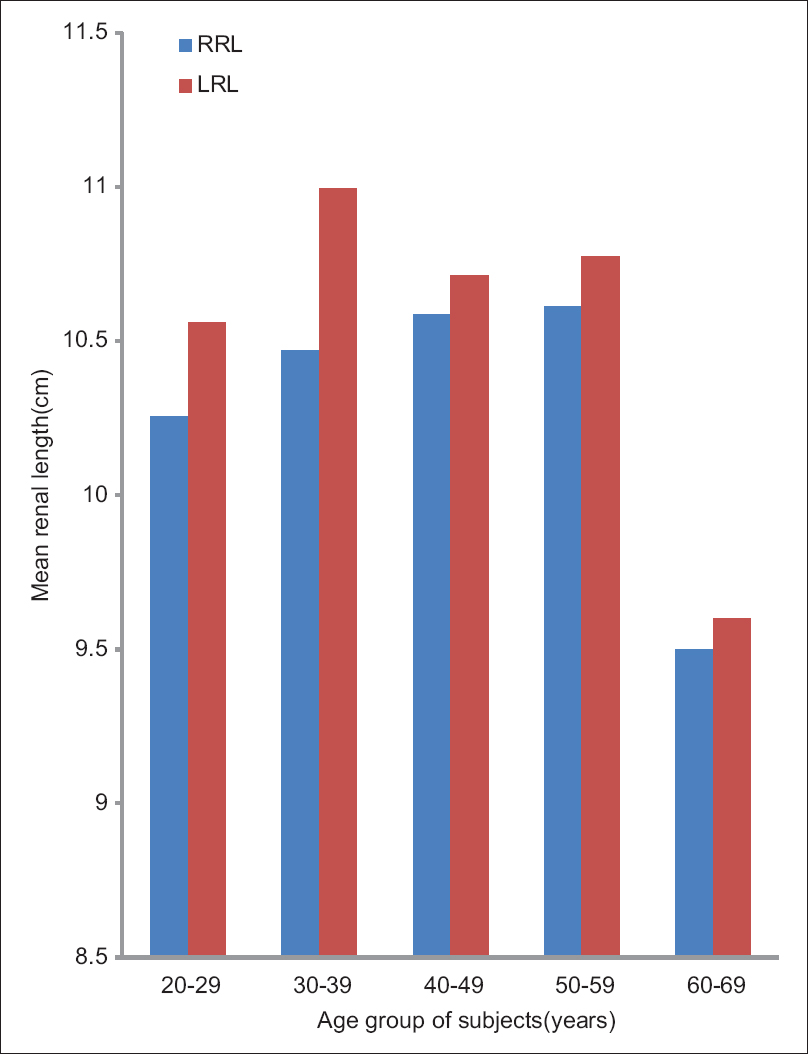
Figure 3: Bar chart showing the distribution of renal lengths (in centimeters) with increasing age (in years) in male subjects
| Close | |
|
|
|
|
Figure 3: Bar chart showing the distribution of renal lengths (in centimeters) with increasing age (in years) in male subjects
|
|