|
 
 |
|
ORIGINAL ARTICLE |
|
|
|
| Year : 2011 | Volume
: 17
| Issue : 3 | Page : 169-174 |
| |
Haptoglobin polymorphism among the tribal groups of southern Gujarat
Priyanka Khurana, Aastha Aggarwal, Suraj Singh Huidrom, Gautam K Kshatriya
Department of Anthropology, University of Delhi (North Campus), Delhi-110 007, India
| Date of Web Publication | 20-Jan-2012 |
Correspondence Address:
Gautam K Kshatriya
Department of Anthropology, University of Delhi, Delhi-110 007
India
 Source of Support: None, Conflict of Interest: None
DOI: 10.4103/0971-6866.92096

 Abstract Abstract | | |
Background : Gujarat is located at the western most point of the Indian subcontinent. Valsad and Surat districts are part of the 'tribal belt' of Gujarat and constitute 29.1% of total tribal population of Gujarat. These tribal populations are a rich source of gaining insights in the patterns of genetic diversity and genetico-environmental disorders against the back drop of their ecological, historical and ethnographic aspects.
Aim : The objectives were to find out a) the genetic diversity among the tribes of Gujarat with reference to haptoglobin (Hp) locus b) the relationship between Hp polymorphism and sickle cell anemia/trait.
Materials and Methods: 431 individuals belonging to eight tribal groups were studied for Hp polymorphism using polyacrylamide disc gel electrophoresis (PAGE). Hb*S was screened by dithionate tube turbididy (DTT) test and confirmed using cellulose acetate membrane electrophoresis (CAME).
Statistical Analysis: Allele frequency was calculated by direct gene counting method. Average heterozygosity and gene diversity were computed using software DISPAN. Analysis of molecular variance (AMOVA) was estimated using software ARLEQUIN version 3.1.
Results and Conclusions: Pattern of allele frequency distribution showed preponderance of Hp 2 allele in all the eight tribal groups, which is in accordance with its frequency in different populations of Indian subcontinent. Total average heterozygosity (H T ) was found to be low (0.160) but the level of genetic differentiation (G ST ) was found to be moderately high (5.6%). AMOVA analysis indicated least among group variance between west and south Indian populations (-0.04%) indicating the affinities of the tribes of Gujarat with that of Dravidian speaking groups. Analysis of Hp phenotypes among sickle cell anemia/ trait individuals revealed a high frequency of Hp 0-0 phenotype (92.7%) among SS individuals as opposed to only 9.7% among AS individuals, reaffirming the selective advantage of HbAS state in relation to hemolytic disorders.
Keywords: AMOVA , haptoglobin, heterozygosity, hypohaptoglobinaemia, sickle cell anemia, tribes.
How to cite this article:
Khurana P, Aggarwal A, Huidrom SS, Kshatriya GK. Haptoglobin polymorphism among the tribal groups of southern Gujarat. Indian J Hum Genet 2011;17:169-74 |
How to cite this URL:
Khurana P, Aggarwal A, Huidrom SS, Kshatriya GK. Haptoglobin polymorphism among the tribal groups of southern Gujarat. Indian J Hum Genet [serial online] 2011 [cited 2016 May 13];17:169-74. Available from: http://www.ijhg.com/text.asp?2011/17/3/169/92096 |
| Introduction | |  |
India is known to be a land of diversity and has a large number of castes, tribes and religious communities. It has been estimated that the Indian national population is composed of some 50,000 to 60,000 essentially endogamous sub-populations. [1] Existence of these restricted gene pools provides ample scope for studying the extent of genetic diversity within and between populations and to relate observed patterns of affinities with cultural, linguistic and demographic histories of the populations. In this context, tribal populations in particular are a rich source of gaining meaningful insights on the pattern of genetic diversity in the backdrop of their ethnographic histories.
The tribal populations are possibly the original inhabitants of India [2],[3] and at present constitute 8.2% of the total population of India. [4] Ironically, Gujarat state of western India, which is home to 8.87% of the total tribal population of India, [5] has not been extensively studied from anthropological point of view. Keeping this in view, we examined a) the genetic diversity with reference to haptoglobin (Hp) locus among the eight tribal population groups of Gujarat, western India and b) the relationship between Hp polymorphism and sickle cell anemia/trait.
| Materials and Methods | | |
The present study is conducted among the eight tribal population groups namely Dhodia, Dubla, Konkana, Gamit, Vasava, Mota Chaudhary, Nana Chaudhary and Pavagadhi Chaudhary from Valsad and Surat districts of Gujarat. All the groups speak languages belonging to Indo-European linguistic family and are affiliated to Proto-Australoid ethnic stock. [6] [Table 1] presents the distribution of samples by tribes and area of collection. 5 ml of intravenous blood was collected from 431 randomly selected unrelated individuals from the eight tribal populations in ethylene diamine tetra acetic acid (EDTA) coated vacutainers, with their prior informed written consent. After the sample collection, 0.5-1 ml of plasma was separated by centrifuging the tubes at 3000-3400 rotations per minute (rpm) for 10-15 min at room temperature on the same day and stored in refrigerator at -20°C. Hp phenotypes were determined from plasma samples using polyacrylamide disc gel electrophoresis (PAGE) technique. [7] Another 1-2 ml of blood samples were used for identifying sickle cell individuals employing dithionate tube turbidity (DTT) test. [8] The samples identified positive for sickle cell (Hb*S) were further subjected to cellulose acetate membrane electrophoresis (CAME) [9] for recognizing homozygous SS and heterozygous AS hemoglobin states. Remaining blood samples were used for the purpose of DNA extraction for later use. Allele frequency was calculated by direct gene counting method for each population and Hardy-Weinberg equilibrium was verified using Chi-square goodness of fit test. Average heterozygosity and gene differentiation at the Hp locus were computed using software DISPAN. [10] Analysis of molecular variance (AMOVA) was estimated using software ARLEQUIN version 3.1. [11]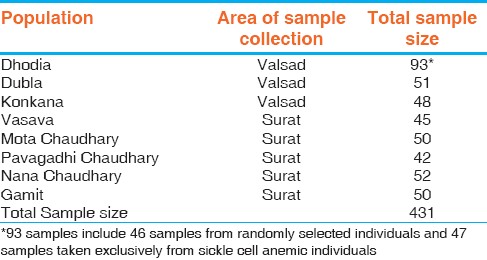 | Table 1: Distribution of samples by tribes and area of sample collection
Click here to view |
A brief ethnographic profile of the eight tribal groups is presented below:
Konkana: Konkanas in Gujarat are immigrants from western coastal strip of Maharashtra, western India. Konkanas largely depend upon agriculture, agriculture labor, fishing and collection of minor forest products for their subsistence. The community is divided into several exogamous units like Mahala, Gavid, Gavit, Gaikwad etc. They practice group endogamy and clan exogamy. According to the Census of India (2001), the total population of Konkana in Gujarat is 3, 29, 496.
Dhodia: Dhodias are one of the largest tribal groups of Gujarat state (western India) with the total population size of 5, 86,108. [4] The origin of Dhodia is shrouded in mystery and has been given different interpretations. They are mainly agriculturists. The Dhodia are subdivided into a number of equally ranked exogamous clans.
Dubla: Dublas are also known as Halpati. They are one of the predominant tribal groups in Gujarat state (western India) with the total population of 5, 96,865 individuals. [4] Their origin and ethnic affinities are unclear. Land is their main economic resource. The tribe is subdivided into twenty exogamous clans. They are monogamous and Hindu by religion.
Vasava: Bhils with the population size of 3,441,945 represents 46% of the total scheduled tribe (ST) population of Gujarat. [4] Vasava community constitutes one of the major groups of Bhils in Gujarat. [12] Their main occupation is agriculture. Vasavas are an endogamous community maintaining clan and village exogamy. They are monogamous and follow patrilineal, patrilocal and patriarchal rules of marriage and kinship.
Gamit: Gamits are migrants from south of Konkan coast near Goa. [13] Their physical features qualify them to be categorized under Proto-Australoid group. [14] Gamits are endogamous and have a number of exogamous clans. They are mostly monogamous, but few cases of polygyny are also seen. They are Hindu by religion. Gamits are mainly agriculturists while some are employed in white collar jobs and others work as laborers. According to the Census of India (2001), Gamits number is 3, 54, 362 in Gujarat.
Chaudhary: Chaudharys are one of the indigenous tribal groups of Gujarat, western India. The traditional occupation of the tribe is agriculture followed by animal husbandry. Their spoken dialect belongs to the Indo-European family of languages. Their origin has been subjected to various interpretations. Chaudharys are divided into five sub-groups namely, Mota Chaudhary, Nana Chaudhary, Pavagadhi Chaudhary, Valavada Chaudhary and Bonda Chaudhary. Marriages among the sub-groups are prohibited except between Nana and Pavagadhi Chaudhary. For this reason, Mota Chaudhary has been considered as a separate Mendelian population in the present study. The total population of Chaudhary has been enumerated as 2,82,392 in Gujarat. [4]
| Results | | |
[Table 2] summarizes the phenotypic distribution of Hp polymorphism. The Hp 0-0 phenotype frequency varies from 7.14% among Pavagadhi Chaudhary to 1.96% among Dubla in randomly selected individuals. The number of individuals reported as having Hp0-0 phenotype has been excluded for Hp 1 and Hp 2 allele frequency estimation. | Table 2: Haptoglobin phenotype distribution among the eight tribal populations of Gujarat
Click here to view |
[Table 3] presents the allele frequencies of Hp alleles in the eight tribal populations of Gujarat. Hp 2 allele frequency is found to be higher than Hp 1 allele in all the tribal populations under study. The highest frequency of Hp 2 allele (1.00) is observed among Pavagadhi Chaudhary and lowest (0.812) among Gamit. Allele frequencies were subjected to goodness of fit Chi square test to observe any departure of observed and expected Hp allele frequencies from Hardy-Weinberg proportions in the studied populations. The analysis revealed that, barring Gamit and Vasava, overall pattern of Hp allele frequencies are in agreement with their expected Hardy-Weinberg proportion in all other populations. | Table 3: Haptoglobin allele frequency distribution among the eight tribal populations of Gujarat
Click here to view |
Heterozygosity values in the eight populations of Gujarat are listed in [Table 4]. The heterozygosity values are found to vary from 0.000 in Pavagadhi Chaudhary to 0.307 in Gamit with an average of 0.153 in pooled populations. The extent of average heterozygosity (H T ) and genetic differentiation (G ST ) was found to be 16.0 and 5.6% respectively (data not shown). | Table 4: Heterozygosity values at haptoglobin locus among the eight tribal populations of Gujarat
Click here to view |
[Table 5] presents data on analysis of variance undertaken among the populations grouped on the basis of their geographical location into four categories. The results indicate that within population component of variance in all the comparisons constitutes the major component of variance. Among group variance is found to be low for all categories of comparisons. In spite of this, a gradation could be observed for this component between the various categories. The least among group variance is found between the southern and western Indian populations (-0.04%) followed by that between northern and western Indian populations (0.79%). When the three geographical zones of India namely north, west and south are considered, it is observed that among group variance is 0.81%. Maximum among group variance is found between the northern and southern Indian populations (1.5%). All the values were found to be statistically significant. | Table 5: Extent of genetic differentiation estimated by AMOVA among populations of Gujarat with other Indian populations of different geographical regions based on haptoglobin locus
Click here to view |
431 individuals were screened for Hb*S and out of which 82 individuals were detected positive. Of these 82 samples, 41 were found to be homozygous SS and 41 heterozygous AS. [Table 6] demonstrates the frequency distribution difference between Hp 0-0 phenotype and the other Hp phenotypes (Hp 1-1, Hp 1-2, Hp 2-2) among the 82 samples. Frequencies of Hp 0-0 and other Hp phenotypes among the 82 HbSS/AS samples were found to be 51.2% and 48.8% respectively. However marked disparity was observed between SS and AS individuals with respect to the Hp 0-0 and other Hp phenotypes frequency distribution pattern. Remarkably high frequency of Hp 0-0 phenotype (92.7%) in contrast to 7.3% frequency of other Hp phenotypes was observed among SS individuals. Conversely 9.7% occurrence rate of Hp 0-0 phenotype and 90.3% frequency of other Hp phenotypes were noticed among AS individuals.  | Table 6: Distribution of Hp 0-0 phenotype versus other haptoglobin phenotypes among HbSS and HbAS individuals
Click here to view |
| Discussion | | |
Due to the strategic geographic location, Gujarat serves as a major corridor for the entry of people of diverse ethnic and cultural backgrounds, which is apparent from the existence of one of the oldest civilization of world at Lothal, Dholavira, Surkotda. [15] Further with the tribal strength of 14.8% of the total population of Gujarat, few genetic studies have so far been undertaken on the tribal groups of Gujarat with reference to Hp polymorphism. [16]
In the present study, we examined the distribution of Hp polymorphic system in the eight tribal populations of Gujarat, India. The allele frequency distribution in the eight tribal study groups revealed the preponderance of Hp 2 allele with the frequency ranging from a maximum of 1.00 among Pavagadhi Chaudhary to a minimum of 0.812 among Gamit [Table 3]. The results are consistent with the findings from other studies undertaken in the Gujarat region where the Hp 2 allele frequency has been found to vary from 0.93 in Gamit [16] to 0.724 in Visa Oswal Jain. [17] It would be worth mentioning here that the frequency of Hp 2 allele has been found to be consistently high across various states and in different ethnic groups in India; ranging from 1.00 among Bhumij from West Bengal [18] to 0.597 among Christian Siddis from Karnataka [19] with an average of 82.3. The high frequency of Hp 2 allele throughout the subcontinent in spite of the diverse ethnic groups may be an indicative of common selection pressure operating on the Hp locus.
So far malaria has been identified as the strongest known selective pressure [20],[21] possibly contributing to characteristic distribution of Hp alleles. The highest Hp 2 allele frequency has been reported from south and south-east Asia and lowest from south America. [22] The mechanism involved in providing protection against malaria is based on the difference in biochemical properties of Hp2-2 polymer from Hp1-1 and Hp2-1 polymers. Hp2-2 polymer has weaker hemoglobin (Hb) binding capacity, is present in lower concentration in circulation, is a weaker antioxidant, and have high immune reactivity than Hp 1-1 and Hp 2-1 polymers. [23],[24] The cumulative effect of all these factors along with the persistent hemolysis associated with malaria induces great oxidative stress on red blood cells (RBCs) resulting in their destruction and elimination along with the parasite living inside them from the spleen thus conferring protection against malaria.
Despite several investigations, association between the Hp system and malaria is still controversial, with some studies supporting the hypothesis of protective effect of Hp 2 allele [25],[26],[27],[28] and others presenting contradictory evidence. [29],[30] Thus, further investigations might give valuable information concerning the selection pressure operating on Hp alleles and the dynamics behind their spread in different geographical regions.
In the present study, the Hp marker has also been utilized to assess the genetic heterogeneity between the populations. The heterozygosity values are variable [Table 4] and can be attributed to different demographic history of these groups in the past. The genomic diversity analysis when performed after combining the phenotypic findings on presently studied tribes with previously studied 11 population groups of Gujarat [31] showed a decrease in G ST values from 0.056 (in 8 studied groups) to 0.049 (in 19 groups of Gujarat) (data not shown), indicating the underlying genomic uniformity between the populations of Gujarat.
The analysis of molecular variance [Table 5] considering the three geographical regions of the country (north, west, south India) exhibit remarkably low component of among group variance between the three zones (0.81%), indicating the common selective pressure operating over all the regions lending conceivable support to the spread of Hp 2 allele over Hp 1 allele. This finding can also be interpreted in terms of common genetic substratum of Indian populations which might have responded in the similar ways throughout the subcontinent displacing the Hp 1 allele and promoting the spread of Hp 2 allele under certain specific conditions.
Despite, such a small percentage of variance between the three zones of India, AMOVA is found to be surprisingly sensitive to capture differences in variance between north-west, south-west and north-south regions. The west and south Indian populations exhibit the least among group variance (-0.04%) followed by the comparisons between north and west (0.79%) and north and south (1.5%) Indian populations [Table 5]. The low component of among group variance between western and southern Indian populations with respect to Hp locus indicates the possible genetic congruence between the two linguistically dissimilar groups namely Indo-European speaking tribes of Gujarat with Dravidian speaking south Indian populations. Whereas the highest percentage of among group variance between the northern and southern Indian populations could be attributed either to differences in ethnic constitution between the populations of these regions or to great geographical distance between the regions.
The high frequency of Hp 0-0 phenotype among sickle cell patients [Table 6] can be explained due to the persistent hemolysis in case of sickle cell anemia resulting into profound degree of hypohaptoglobinaemia, which is relatively insensitive to detection by electrophoresis. Many diseases associated with excessive RBC destruction such as sickle cell anemia, impaired liver function are shown to have less quantity of Hp in their sera. Thus, the high frequency of Hp 0-0 phenotype in the present study is in conformity with the other such similar studies showing the presence of Hp 0-0 phenotype in hematological diseases. [32],[33] Marked higher frequency of other Hp phenotypes (90.3%) and approximately ten folds lower frequency of Hp 0-0 phenotype (9.7%) among AS individuals probably reflects selective advantage of heterozygosity of HbS allele, conferring protection against characteristic profound episodes of hemolysis in SS individuals. Thus, disparity in frequency distribution of Hp 0-0 phenotype among homozygous SS and heterozygous AS individuals probably represents one of the few examples of selective advantage of heterozygous state over homozygous condition.
| Acknowledgement | | |
We would like to thank all the individuals who volunteered to provide blood samples for the study. We are also thankful to Dr. I. Italia and Mr. Bhavesh Raicha and the team of Valsad Raktdan Kendra (Centre for blood donation, Valsad), Valsad, Gujarat for helping us during the fieldwork. The authors are also thankful to Dr. K. N. Saraswathy, Department of Anthropology University of Delhi for her valuable suggestions. The authors wish to thank Department of Biotechnology (DBT), New Delhi for providing us necessary grant (vide letter BT/PR9840/MED/12/366/2007) in support of the project. We also wish to thank Department of Anthropology, University of Delhi, Delhi for granting us ethical clearance necessary for getting grant from DBT, Delhi. While undertaking the study, we strictly complied with the ethical guidance of the committee.
| References | | |
| 1. | Gadgil M, Joshi NV, Shambu Prasad UV, Manoharan S, Patil S. Peopling of India. In: Balasubramanian D, Rao NN, editors. The Indian Human Heritage Universities Press, Hyderabad: University Press; 1997. p. 100-29. 
|
| 2. | Thapar R. A history of India, Volume 1. Middlesex, UK: Penguin; 1966.
|
| 3. | Ray N. Nationalism in India. Aligarh, India: Aligarh Muslim University; 1973.
|
| 4. | Census of India. Registrar General and Census commissioner, Government of India; 2001.
|
| 5. | Ministry of tribal affairs, Statistics report. Available from: http://www.tribal.nic.in/writereaddata/mainlinkFile/File891.pdf. [Last cited in 2010].
|
| 6. | Fuchs S. Anthropometry of the Gujarat tribes. In: Shah PG, editor. Tribal life in Gujarat. Mumbai: Gujarat Research Society; 1964. p. 263-75.
|
| 7. | Raymond S, Weintraub L. Acrylamide gel as asupporting medium or zone electrophoresis. Science 1959;130:711.
[PUBMED] [FULLTEXT] |
| 8. | Nalbandian RM, Nichols BM, Camp FR Jr, Lusher JM, Conte NF, Henry RL, et al. Dithionite tube test: A rapid, inexpensive technique for the detection of hemoglobin S and Non-S sickling hemoglobin. Clin Chem 1971;17:1028-32.
[PUBMED] [FULLTEXT] |
| 9. | Toda T, Fujita T, Ohash M. Two-dimensional electrophoresis on the layers of cellulose acetate membrane. Analyt Biochem 1982;119:167-76.
|
| 10. | Ota T. DISPAN: computer program for genetic distance and phylogenetic analysis. United States: Institute of Molecular and Evolutionary Genetics, Pennsylvania State University; 1993.
|
| 11. | Excoffier L, Laval G, Schneider S. Arlequin, version 3.11: An integrated software package for population genetics data analysis. Evol Bioinform Online 2005;1:47-50.
|
| 12. | Enthovan RE. The tribes and castes of Bombay. Vol. 2. Delhi: Cosmos Publications; 1975
|
| 13. | Enthovan RE. The tribes and castes of Bombay. Vol. 1. Delhi: Cosmos publications; 1920.
|
| 14. | Vyas GM, Bhatia HM, Bankar DD, Purandare NM. 1958 Study of blood groups and other genetical characteristics in six gujarati endogamous groups in western India. Ann Hum Genet 1958;22:185-99.
|
| 15. | Ghosh A, editor. Encyclopedia of Indian Archaeology. Vol. 2. New Delhi: Munshiram Manoharlal; 1989.
|
| 16. | Bhasin MK, Singh IP, Sudhakar K, Bhardwaj V, Chahal SM, Walter H, et al. Genetic studies in four tribal populations of the Surat District, Gujarat (India). Ann Hum Biol 1985;12:27-39.
[PUBMED] |
| 17. | Baxi AJ, Parikh NP, Jhala HI. Haptolobin and transferrin types in three Gujarati speaking group. Indian J Med Res 1969;57:2087-91.
|
| 18. | Giri AK, Data S, Gajara B, Ray Chaudhary A, Talukder G, Sharma A. Some genetic markers in tribal of eastern India. Acta Anthrpo Genet 1982;6:99-106.
|
| 19. | Vijaykumar M, Malhotara KC, Walter H, Gilbert K, Lindenburg P, Dannewitz A, et al. Genetic study among the siddies of Karnataka, India: A migrant population from Africa. Z Morph Anthrop 1987;77:97-122.
|
| 20. | Kwiatkowski DP. How malaria has affected the human genome and what human genetics can teach us about malaria. Am J Hum Genet 2005;77:171-90.
[PUBMED] [FULLTEXT] |
| 21. | Quaye IK. Haptoglobin, inflammation and disease. Trans R Soc Trop Med Hyg 2008;102:735-42.
[PUBMED] [FULLTEXT] |
| 22. | Carter K, Worwood M. Haptoglobin: A review of the major allele frequencies Worldwide and their association with diseases. Int J Lab Hem 2007;29:92-110.
|
| 23. | Giblet ER. Genetic markers in human blood: Blackwell scientific publication. Oxford and Edenburgh; 1969.
|
| 24. | Langlois MR, Delanghe JR. Biological and clinical significance of haptoglobin polymorphism in humans. Clin Chem 1996;42:1589-600.
[PUBMED] [FULLTEXT] |
| 25. | Singh IP, Walter H, Bhasin MK, Bhardwaj V, Sudhakar K. Genetic markers and malaria. Observations in Gujarat, India. Hum Hered 1986;36:31-6.
[PUBMED] |
| 26. | Elagib AA, Kider AO, Akerstrom B, Elbashir MI. Association of the haptoglobin phenotype (1-1) with falciparum malaria in Sudan. Trans R Soc Trop Med Hyg 1998;92:309-11.
|
| 27. | Bottini N, Ronchetti MP, Gloria-Bottini F, Fontana L. Malaria as a possible evolutionary cause of allergy. Allergy 1999;54:188-9.
[PUBMED] [FULLTEXT] |
| 28. | Minang JT, Gyan BA, Anchang JK, Troye-Blomberg M, Perlmann H, Achidi EA. Haptoglobin phenotypes and malaria infection in pregnant women at delivery in western Cameroon. Acta Trop 2004;90:107-14.
[PUBMED] [FULLTEXT] |
| 29. | Aucan C, Walley AJ, Greenwood BM, Hill AV. Haptoglobin genotypes are not associated with resistance to severe malaria in The Gambia. Trans R Soc Trop Med Hyg 2002;96:327-8.
[PUBMED] |
| 30. | Bienzle U, Eggelte TA, Adjei LA, Dietz E, Ehrhardt S, Cramer JP, et al. Limited influence of haptoglobin genotypes on severe malaria in Ghanaian children. Trop Med Int Health 2005;10:668-71.
[PUBMED] [FULLTEXT] |
| 31. | Bhasin MK, Walter H, Danker Hopfe H. The distribution of genetical, morphological and behavioural trait among the people of India. Delhi: Kamala Raj Enterprise; 1992.
|
| 32. | Delanghe J, Langlois M, Buyzere MD. Congenital anhaptoglobinaemia versus acquired hypohaptoglobinaemia. Blood 1998;91:3524.
|
| 33. | Rogerson S. What is the relationship between haptoglobin, malaria, and anaemia? PLoS Med 2006;6:e200.
|
[Table 1], [Table 2], [Table 3], [Table 4], [Table 5], [Table 6]
|