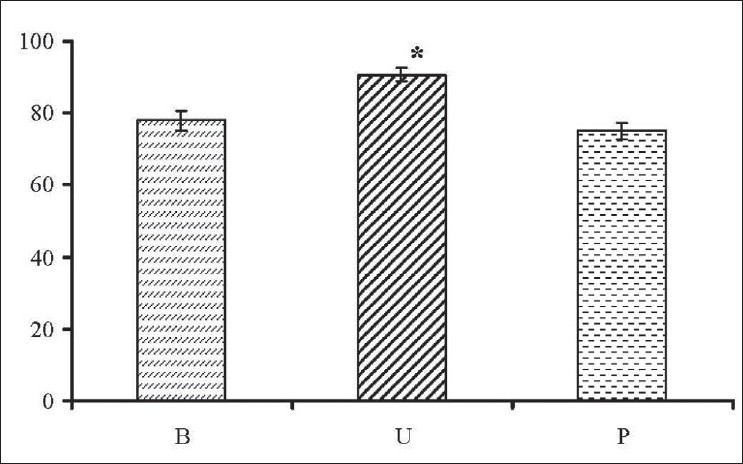
Figure 1: Comparison of different tissues of smoker group. The percentage of genotoxic effect of smoking on the buccal (B), urethral (U), and peripheric blood (P) tissues. Numbers were given as mean ± s.e.m. * represents the degree of signifi cance between the groups (P<0.05).